Immigrants from Cambodia vs Paiute 8th Grade
COMPARE
Immigrants from Cambodia
Paiute
8th Grade
8th Grade Comparison
Immigrants from Cambodia
Paiute
93.3%
8TH GRADE
0.0/ 100
METRIC RATING
316th/ 347
METRIC RANK
95.1%
8TH GRADE
1.7/ 100
METRIC RATING
243rd/ 347
METRIC RANK
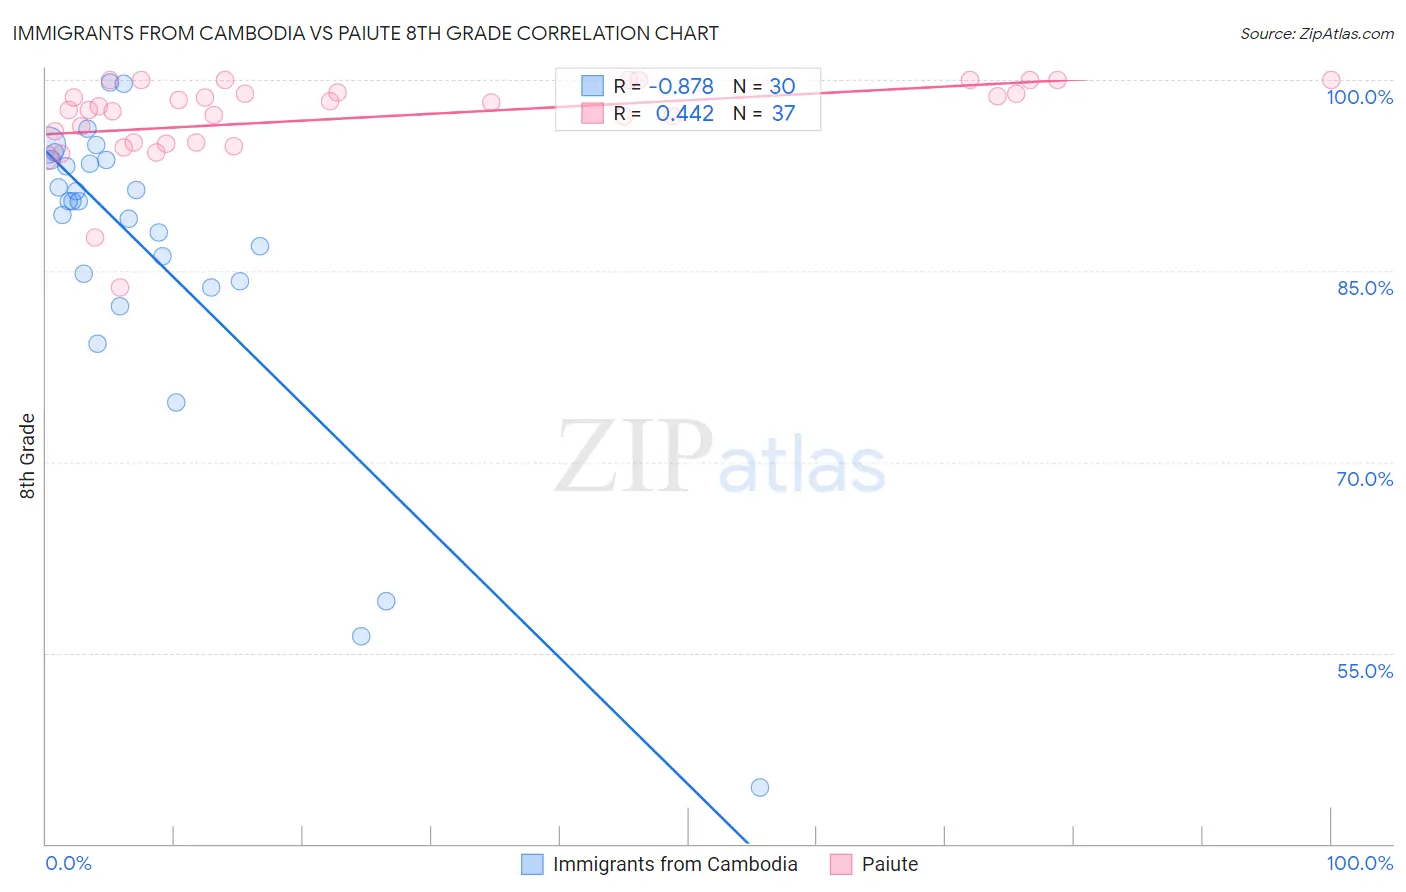
Immigrants from Cambodia vs Paiute 8th Grade Correlation Chart
The statistical analysis conducted on geographies consisting of 205,153,442 people shows a very strong negative correlation between the proportion of Immigrants from Cambodia and percentage of population with at least 8th grade education in the United States with a correlation coefficient (R) of -0.878 and weighted average of 93.3%. Similarly, the statistical analysis conducted on geographies consisting of 58,403,520 people shows a moderate positive correlation between the proportion of Paiute and percentage of population with at least 8th grade education in the United States with a correlation coefficient (R) of 0.442 and weighted average of 95.1%, a difference of 1.9%.
8th Grade Correlation Summary
| Measurement | Immigrants from Cambodia | Paiute |
| Minimum | 44.4% | 83.7% |
| Maximum | 99.8% | 100.0% |
| Range | 55.4% | 16.3% |
| Mean | 86.3% | 97.1% |
| Median | 90.5% | 97.9% |
| Interquartile 25% (IQ1) | 84.2% | 95.1% |
| Interquartile 75% (IQ3) | 93.7% | 99.5% |
| Interquartile Range (IQR) | 9.5% | 4.4% |
| Standard Deviation (Sample) | 12.6% | 3.4% |
| Standard Deviation (Population) | 12.4% | 3.4% |
Similar Demographics by 8th Grade
Demographics Similar to Immigrants from Cambodia by 8th Grade
In terms of 8th grade, the demographic groups most similar to Immigrants from Cambodia are Immigrants from Ecuador (93.3%, a difference of 0.060%), Puerto Rican (93.2%, a difference of 0.060%), Immigrants from Cuba (93.2%, a difference of 0.10%), Immigrants from Fiji (93.2%, a difference of 0.12%), and Vietnamese (93.5%, a difference of 0.19%).
| Demographics | Rating | Rank | 8th Grade |
| Immigrants | Immigrants | 0.0 /100 | #309 | Tragic 93.6% |
| Japanese | 0.0 /100 | #310 | Tragic 93.6% |
| Immigrants | Bangladesh | 0.0 /100 | #311 | Tragic 93.6% |
| Cape Verdeans | 0.0 /100 | #312 | Tragic 93.5% |
| Immigrants | Caribbean | 0.0 /100 | #313 | Tragic 93.5% |
| Immigrants | Vietnam | 0.0 /100 | #314 | Tragic 93.5% |
| Vietnamese | 0.0 /100 | #315 | Tragic 93.5% |
| Immigrants | Cambodia | 0.0 /100 | #316 | Tragic 93.3% |
| Immigrants | Ecuador | 0.0 /100 | #317 | Tragic 93.3% |
| Puerto Ricans | 0.0 /100 | #318 | Tragic 93.2% |
| Immigrants | Cuba | 0.0 /100 | #319 | Tragic 93.2% |
| Immigrants | Fiji | 0.0 /100 | #320 | Tragic 93.2% |
| Belizeans | 0.0 /100 | #321 | Tragic 93.1% |
| Nicaraguans | 0.0 /100 | #322 | Tragic 93.0% |
| Immigrants | Belize | 0.0 /100 | #323 | Tragic 92.9% |
Demographics Similar to Paiute by 8th Grade
In terms of 8th grade, the demographic groups most similar to Paiute are Tongan (95.1%, a difference of 0.0%), Immigrants from Middle Africa (95.1%, a difference of 0.0%), South American Indian (95.1%, a difference of 0.020%), Immigrants from Sierra Leone (95.1%, a difference of 0.030%), and Ethiopian (95.1%, a difference of 0.030%).
| Demographics | Rating | Rank | 8th Grade |
| Senegalese | 2.7 /100 | #236 | Tragic 95.2% |
| Immigrants | Africa | 2.7 /100 | #237 | Tragic 95.2% |
| Natives/Alaskans | 2.3 /100 | #238 | Tragic 95.2% |
| Immigrants | Sierra Leone | 2.1 /100 | #239 | Tragic 95.1% |
| Ethiopians | 2.0 /100 | #240 | Tragic 95.1% |
| South American Indians | 1.9 /100 | #241 | Tragic 95.1% |
| Tongans | 1.7 /100 | #242 | Tragic 95.1% |
| Paiute | 1.7 /100 | #243 | Tragic 95.1% |
| Immigrants | Middle Africa | 1.7 /100 | #244 | Tragic 95.1% |
| Jamaicans | 1.4 /100 | #245 | Tragic 95.1% |
| Somalis | 1.4 /100 | #246 | Tragic 95.1% |
| Immigrants | Senegal | 1.4 /100 | #247 | Tragic 95.1% |
| Uruguayans | 1.2 /100 | #248 | Tragic 95.1% |
| Immigrants | China | 1.1 /100 | #249 | Tragic 95.0% |
| Koreans | 1.1 /100 | #250 | Tragic 95.0% |