Immigrants from Belize vs Paiute Median Male Earnings
COMPARE
Immigrants from Belize
Paiute
Median Male Earnings
Median Male Earnings Comparison
Immigrants from Belize
Paiute
$47,809
MEDIAN MALE EARNINGS
0.1/ 100
METRIC RATING
290th/ 347
METRIC RANK
$47,991
MEDIAN MALE EARNINGS
0.2/ 100
METRIC RATING
285th/ 347
METRIC RANK
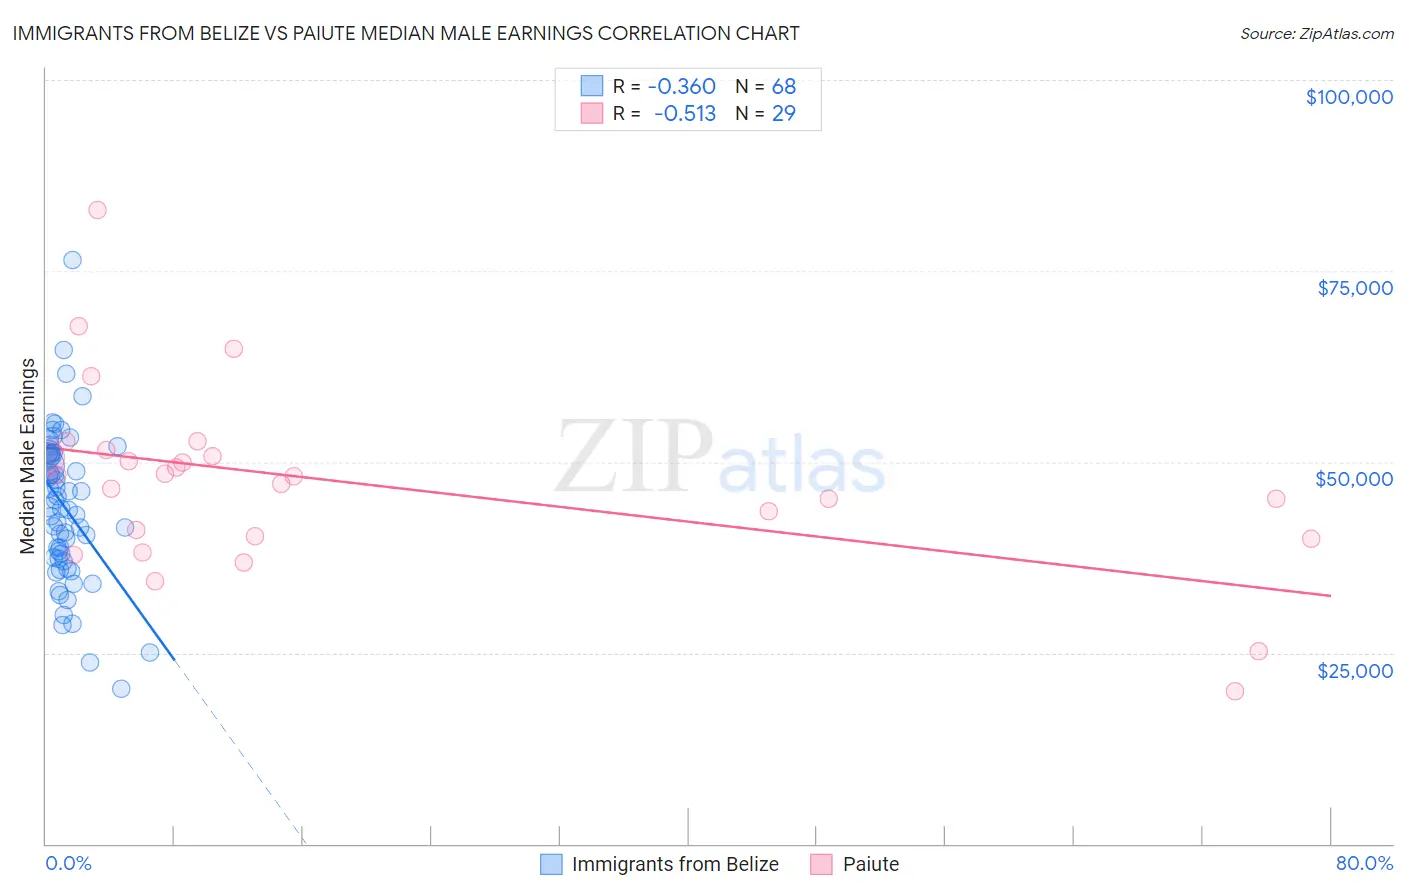
Immigrants from Belize vs Paiute Median Male Earnings Correlation Chart
The statistical analysis conducted on geographies consisting of 130,305,697 people shows a mild negative correlation between the proportion of Immigrants from Belize and median male earnings in the United States with a correlation coefficient (R) of -0.360 and weighted average of $47,809. Similarly, the statistical analysis conducted on geographies consisting of 58,389,146 people shows a substantial negative correlation between the proportion of Paiute and median male earnings in the United States with a correlation coefficient (R) of -0.513 and weighted average of $47,991, a difference of 0.38%.
Median Male Earnings Correlation Summary
| Measurement | Immigrants from Belize | Paiute |
| Minimum | $20,292 | $19,917 |
| Maximum | $76,469 | $82,917 |
| Range | $56,177 | $63,000 |
| Mean | $44,004 | $47,248 |
| Median | $43,946 | $48,199 |
| Interquartile 25% (IQ1) | $37,392 | $40,132 |
| Interquartile 75% (IQ3) | $51,048 | $51,150 |
| Interquartile Range (IQR) | $13,656 | $11,018 |
| Standard Deviation (Sample) | $9,886 | $12,204 |
| Standard Deviation (Population) | $9,813 | $11,992 |
Demographics Similar to Immigrants from Belize and Paiute by Median Male Earnings
In terms of median male earnings, the demographic groups most similar to Immigrants from Belize are Chickasaw ($47,832, a difference of 0.050%), Choctaw ($47,729, a difference of 0.17%), Shoshone ($47,930, a difference of 0.25%), Immigrants from Dominica ($47,651, a difference of 0.33%), and Immigrants from El Salvador ($47,973, a difference of 0.34%). Similarly, the demographic groups most similar to Paiute are Mexican American Indian ($47,990, a difference of 0.0%), African ($47,994, a difference of 0.010%), Immigrants from El Salvador ($47,973, a difference of 0.040%), Immigrants from Jamaica ($48,040, a difference of 0.10%), and Shoshone ($47,930, a difference of 0.13%).
| Demographics | Rating | Rank | Median Male Earnings |
| Belizeans | 0.2 /100 | #277 | Tragic $48,358 |
| Immigrants | Liberia | 0.2 /100 | #278 | Tragic $48,317 |
| Hmong | 0.2 /100 | #279 | Tragic $48,254 |
| Comanche | 0.2 /100 | #280 | Tragic $48,202 |
| Marshallese | 0.2 /100 | #281 | Tragic $48,137 |
| Central Americans | 0.2 /100 | #282 | Tragic $48,093 |
| Immigrants | Jamaica | 0.2 /100 | #283 | Tragic $48,040 |
| Africans | 0.2 /100 | #284 | Tragic $47,994 |
| Paiute | 0.2 /100 | #285 | Tragic $47,991 |
| Mexican American Indians | 0.2 /100 | #286 | Tragic $47,990 |
| Immigrants | El Salvador | 0.2 /100 | #287 | Tragic $47,973 |
| Shoshone | 0.2 /100 | #288 | Tragic $47,930 |
| Chickasaw | 0.1 /100 | #289 | Tragic $47,832 |
| Immigrants | Belize | 0.1 /100 | #290 | Tragic $47,809 |
| Choctaw | 0.1 /100 | #291 | Tragic $47,729 |
| Immigrants | Dominica | 0.1 /100 | #292 | Tragic $47,651 |
| Indonesians | 0.1 /100 | #293 | Tragic $47,503 |
| Immigrants | Nicaragua | 0.1 /100 | #294 | Tragic $47,482 |
| Central American Indians | 0.1 /100 | #295 | Tragic $47,433 |
| Inupiat | 0.1 /100 | #296 | Tragic $47,281 |
| Dominicans | 0.1 /100 | #297 | Tragic $47,204 |