Barbadian vs Paiute 8th Grade
COMPARE
Barbadian
Paiute
8th Grade
8th Grade Comparison
Barbadians
Paiute
94.6%
8TH GRADE
0.1/ 100
METRIC RATING
280th/ 347
METRIC RANK
95.1%
8TH GRADE
1.7/ 100
METRIC RATING
243rd/ 347
METRIC RANK
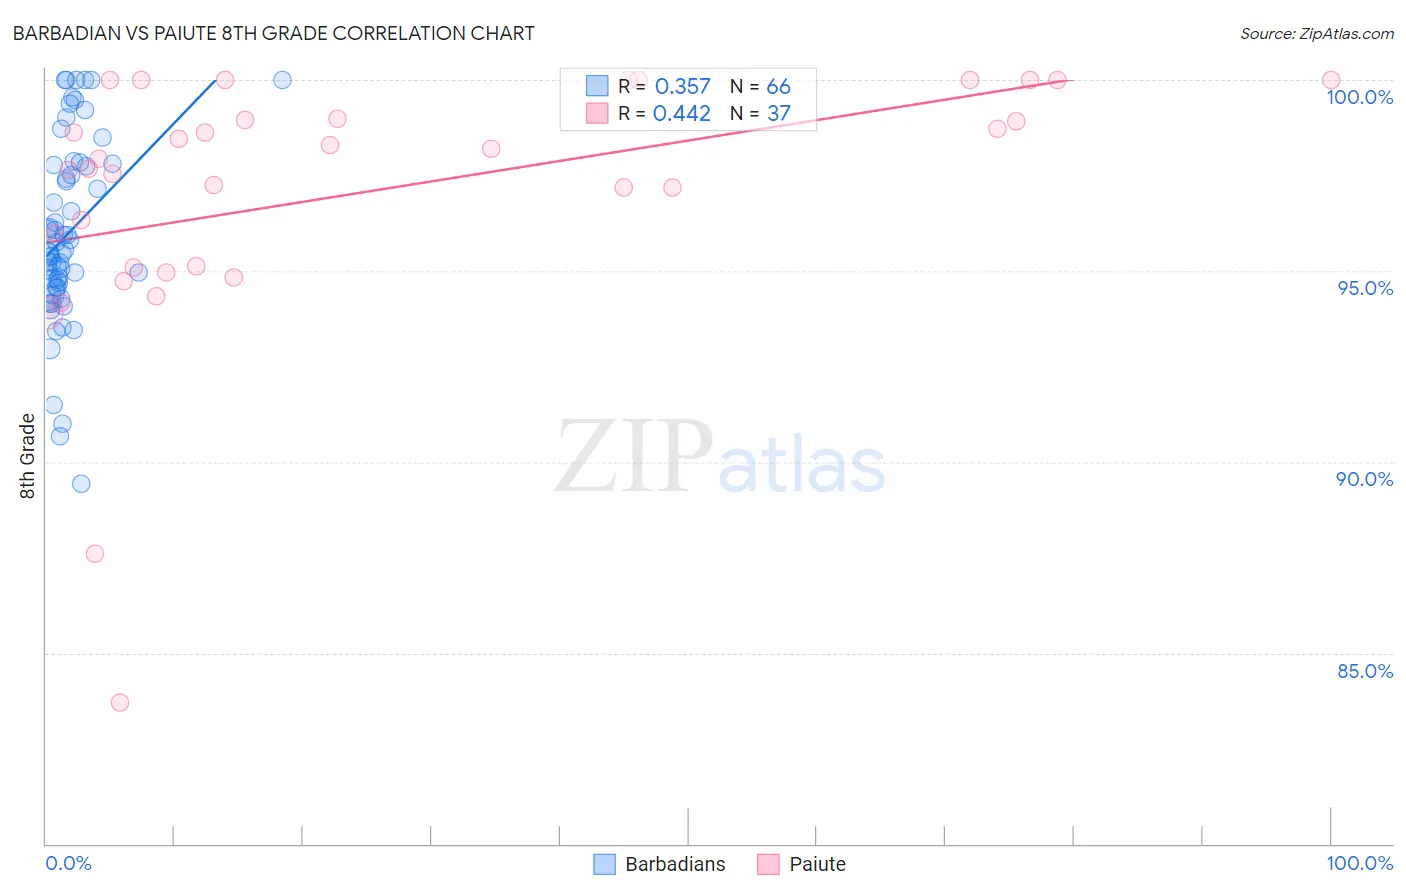
Barbadian vs Paiute 8th Grade Correlation Chart
The statistical analysis conducted on geographies consisting of 141,299,217 people shows a mild positive correlation between the proportion of Barbadians and percentage of population with at least 8th grade education in the United States with a correlation coefficient (R) of 0.357 and weighted average of 94.6%. Similarly, the statistical analysis conducted on geographies consisting of 58,403,520 people shows a moderate positive correlation between the proportion of Paiute and percentage of population with at least 8th grade education in the United States with a correlation coefficient (R) of 0.442 and weighted average of 95.1%, a difference of 0.49%.
8th Grade Correlation Summary
| Measurement | Barbadian | Paiute |
| Minimum | 89.4% | 83.7% |
| Maximum | 100.0% | 100.0% |
| Range | 10.6% | 16.3% |
| Mean | 96.0% | 97.1% |
| Median | 95.5% | 97.9% |
| Interquartile 25% (IQ1) | 94.6% | 95.1% |
| Interquartile 75% (IQ3) | 97.8% | 99.5% |
| Interquartile Range (IQR) | 3.2% | 4.4% |
| Standard Deviation (Sample) | 2.4% | 3.4% |
| Standard Deviation (Population) | 2.4% | 3.4% |
Similar Demographics by 8th Grade
Demographics Similar to Barbadians by 8th Grade
In terms of 8th grade, the demographic groups most similar to Barbadians are Immigrants from Trinidad and Tobago (94.6%, a difference of 0.0%), Immigrants from Bolivia (94.6%, a difference of 0.0%), Armenian (94.7%, a difference of 0.010%), Taiwanese (94.7%, a difference of 0.040%), and Immigrants from Eritrea (94.6%, a difference of 0.040%).
| Demographics | Rating | Rank | 8th Grade |
| Immigrants | Western Africa | 0.2 /100 | #273 | Tragic 94.8% |
| Trinidadians and Tobagonians | 0.2 /100 | #274 | Tragic 94.7% |
| Immigrants | Colombia | 0.2 /100 | #275 | Tragic 94.7% |
| Peruvians | 0.1 /100 | #276 | Tragic 94.7% |
| Taiwanese | 0.1 /100 | #277 | Tragic 94.7% |
| Armenians | 0.1 /100 | #278 | Tragic 94.7% |
| Immigrants | Trinidad and Tobago | 0.1 /100 | #279 | Tragic 94.6% |
| Barbadians | 0.1 /100 | #280 | Tragic 94.6% |
| Immigrants | Bolivia | 0.1 /100 | #281 | Tragic 94.6% |
| Immigrants | Eritrea | 0.1 /100 | #282 | Tragic 94.6% |
| Immigrants | St. Vincent and the Grenadines | 0.1 /100 | #283 | Tragic 94.6% |
| Immigrants | Philippines | 0.1 /100 | #284 | Tragic 94.6% |
| Immigrants | Barbados | 0.0 /100 | #285 | Tragic 94.5% |
| Immigrants | Peru | 0.0 /100 | #286 | Tragic 94.5% |
| Tohono O'odham | 0.0 /100 | #287 | Tragic 94.5% |
Demographics Similar to Paiute by 8th Grade
In terms of 8th grade, the demographic groups most similar to Paiute are Tongan (95.1%, a difference of 0.0%), Immigrants from Middle Africa (95.1%, a difference of 0.0%), South American Indian (95.1%, a difference of 0.020%), Immigrants from Sierra Leone (95.1%, a difference of 0.030%), and Ethiopian (95.1%, a difference of 0.030%).
| Demographics | Rating | Rank | 8th Grade |
| Senegalese | 2.7 /100 | #236 | Tragic 95.2% |
| Immigrants | Africa | 2.7 /100 | #237 | Tragic 95.2% |
| Natives/Alaskans | 2.3 /100 | #238 | Tragic 95.2% |
| Immigrants | Sierra Leone | 2.1 /100 | #239 | Tragic 95.1% |
| Ethiopians | 2.0 /100 | #240 | Tragic 95.1% |
| South American Indians | 1.9 /100 | #241 | Tragic 95.1% |
| Tongans | 1.7 /100 | #242 | Tragic 95.1% |
| Paiute | 1.7 /100 | #243 | Tragic 95.1% |
| Immigrants | Middle Africa | 1.7 /100 | #244 | Tragic 95.1% |
| Jamaicans | 1.4 /100 | #245 | Tragic 95.1% |
| Somalis | 1.4 /100 | #246 | Tragic 95.1% |
| Immigrants | Senegal | 1.4 /100 | #247 | Tragic 95.1% |
| Uruguayans | 1.2 /100 | #248 | Tragic 95.1% |
| Immigrants | China | 1.1 /100 | #249 | Tragic 95.0% |
| Koreans | 1.1 /100 | #250 | Tragic 95.0% |