Immigrants from Bangladesh vs Immigrants from Guatemala Associate's Degree
COMPARE
Immigrants from Bangladesh
Immigrants from Guatemala
Associate's Degree
Associate's Degree Comparison
Immigrants from Bangladesh
Immigrants from Guatemala
45.2%
ASSOCIATE'S DEGREE
21.3/ 100
METRIC RATING
198th/ 347
METRIC RANK
38.1%
ASSOCIATE'S DEGREE
0.0/ 100
METRIC RATING
309th/ 347
METRIC RANK
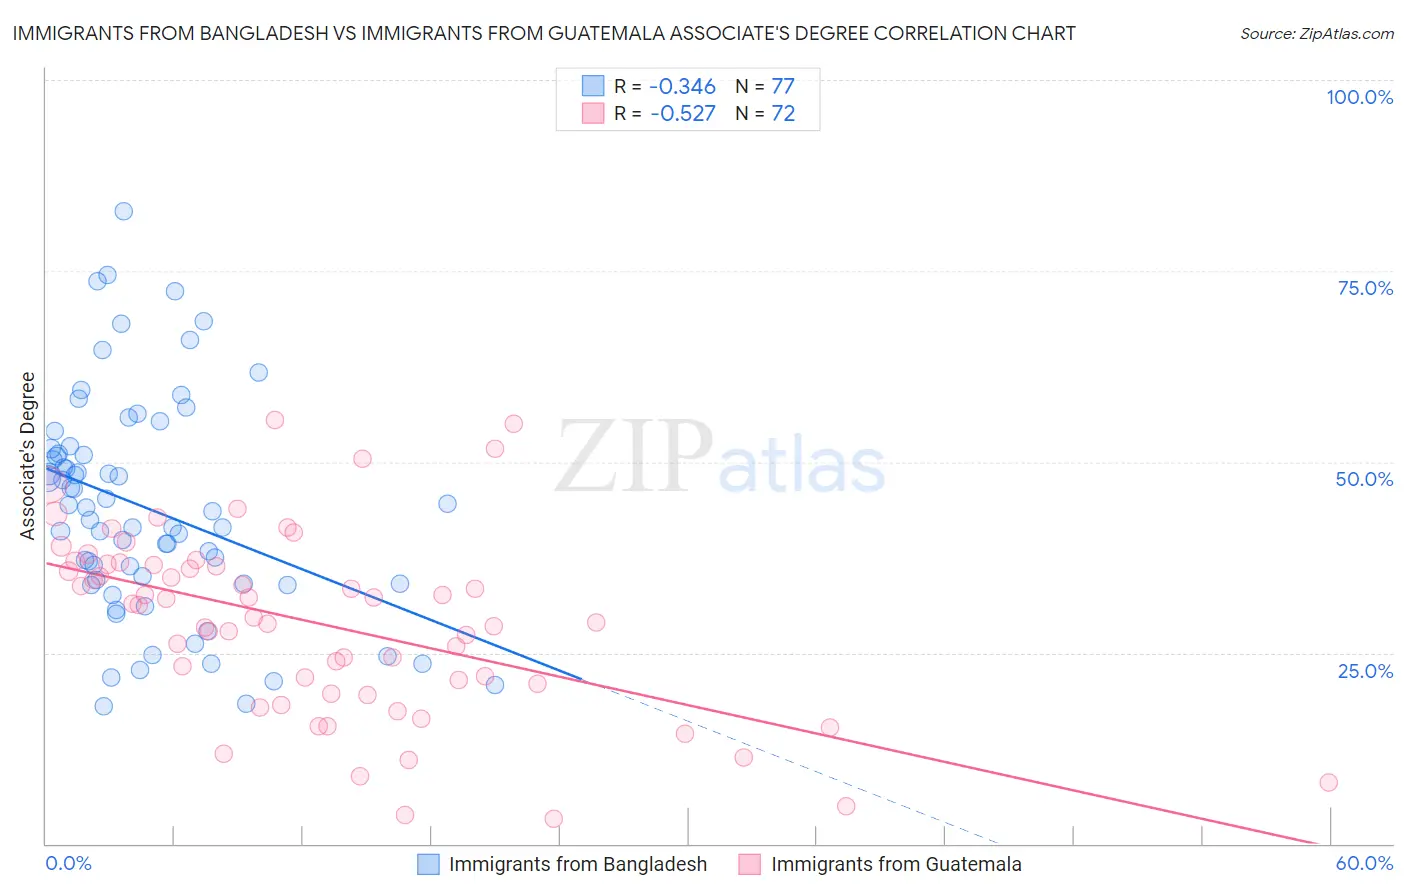
Immigrants from Bangladesh vs Immigrants from Guatemala Associate's Degree Correlation Chart
The statistical analysis conducted on geographies consisting of 203,673,511 people shows a mild negative correlation between the proportion of Immigrants from Bangladesh and percentage of population with at least associate's degree education in the United States with a correlation coefficient (R) of -0.346 and weighted average of 45.2%. Similarly, the statistical analysis conducted on geographies consisting of 377,269,409 people shows a substantial negative correlation between the proportion of Immigrants from Guatemala and percentage of population with at least associate's degree education in the United States with a correlation coefficient (R) of -0.527 and weighted average of 38.1%, a difference of 18.6%.
Associate's Degree Correlation Summary
| Measurement | Immigrants from Bangladesh | Immigrants from Guatemala |
| Minimum | 18.0% | 3.3% |
| Maximum | 82.8% | 55.6% |
| Range | 64.8% | 52.2% |
| Mean | 43.9% | 28.9% |
| Median | 43.6% | 30.4% |
| Interquartile 25% (IQ1) | 34.0% | 20.3% |
| Interquartile 75% (IQ3) | 51.4% | 36.5% |
| Interquartile Range (IQR) | 17.4% | 16.2% |
| Standard Deviation (Sample) | 14.3% | 12.0% |
| Standard Deviation (Population) | 14.2% | 11.9% |
Similar Demographics by Associate's Degree
Demographics Similar to Immigrants from Bangladesh by Associate's Degree
In terms of associate's degree, the demographic groups most similar to Immigrants from Bangladesh are Immigrants from Senegal (45.2%, a difference of 0.020%), Senegalese (45.2%, a difference of 0.030%), Immigrants from Vietnam (45.2%, a difference of 0.060%), Scotch-Irish (45.3%, a difference of 0.10%), and Spaniard (45.2%, a difference of 0.11%).
| Demographics | Rating | Rank | Associate's Degree |
| Koreans | 33.8 /100 | #191 | Fair 45.8% |
| Celtics | 33.3 /100 | #192 | Fair 45.8% |
| Immigrants | Cameroon | 31.0 /100 | #193 | Fair 45.7% |
| Immigrants | Peru | 27.6 /100 | #194 | Fair 45.5% |
| Germans | 26.5 /100 | #195 | Fair 45.5% |
| French | 25.6 /100 | #196 | Fair 45.4% |
| Scotch-Irish | 22.3 /100 | #197 | Fair 45.3% |
| Immigrants | Bangladesh | 21.3 /100 | #198 | Fair 45.2% |
| Immigrants | Senegal | 21.2 /100 | #199 | Fair 45.2% |
| Senegalese | 21.1 /100 | #200 | Fair 45.2% |
| Immigrants | Vietnam | 20.8 /100 | #201 | Fair 45.2% |
| Spaniards | 20.4 /100 | #202 | Fair 45.2% |
| Immigrants | South Eastern Asia | 20.2 /100 | #203 | Fair 45.2% |
| Nigerians | 19.1 /100 | #204 | Poor 45.1% |
| Immigrants | Thailand | 18.9 /100 | #205 | Poor 45.1% |
Demographics Similar to Immigrants from Guatemala by Associate's Degree
In terms of associate's degree, the demographic groups most similar to Immigrants from Guatemala are Mexican American Indian (38.2%, a difference of 0.040%), Immigrants from Dominican Republic (37.9%, a difference of 0.62%), Immigrants from El Salvador (38.4%, a difference of 0.71%), Immigrants from Latin America (37.9%, a difference of 0.73%), and Shoshone (38.4%, a difference of 0.75%).
| Demographics | Rating | Rank | Associate's Degree |
| Colville | 0.0 /100 | #302 | Tragic 38.5% |
| Guatemalans | 0.0 /100 | #303 | Tragic 38.5% |
| Sioux | 0.0 /100 | #304 | Tragic 38.5% |
| Immigrants | Honduras | 0.0 /100 | #305 | Tragic 38.5% |
| Shoshone | 0.0 /100 | #306 | Tragic 38.4% |
| Immigrants | El Salvador | 0.0 /100 | #307 | Tragic 38.4% |
| Mexican American Indians | 0.0 /100 | #308 | Tragic 38.2% |
| Immigrants | Guatemala | 0.0 /100 | #309 | Tragic 38.1% |
| Immigrants | Dominican Republic | 0.0 /100 | #310 | Tragic 37.9% |
| Immigrants | Latin America | 0.0 /100 | #311 | Tragic 37.9% |
| Choctaw | 0.0 /100 | #312 | Tragic 37.8% |
| Hispanics or Latinos | 0.0 /100 | #313 | Tragic 37.7% |
| Seminole | 0.0 /100 | #314 | Tragic 37.7% |
| Creek | 0.0 /100 | #315 | Tragic 37.6% |
| Crow | 0.0 /100 | #316 | Tragic 37.6% |