Immigrants from Bangladesh vs Nicaraguan Associate's Degree
COMPARE
Immigrants from Bangladesh
Nicaraguan
Associate's Degree
Associate's Degree Comparison
Immigrants from Bangladesh
Nicaraguans
45.2%
ASSOCIATE'S DEGREE
21.3/ 100
METRIC RATING
198th/ 347
METRIC RANK
41.5%
ASSOCIATE'S DEGREE
0.4/ 100
METRIC RATING
261st/ 347
METRIC RANK
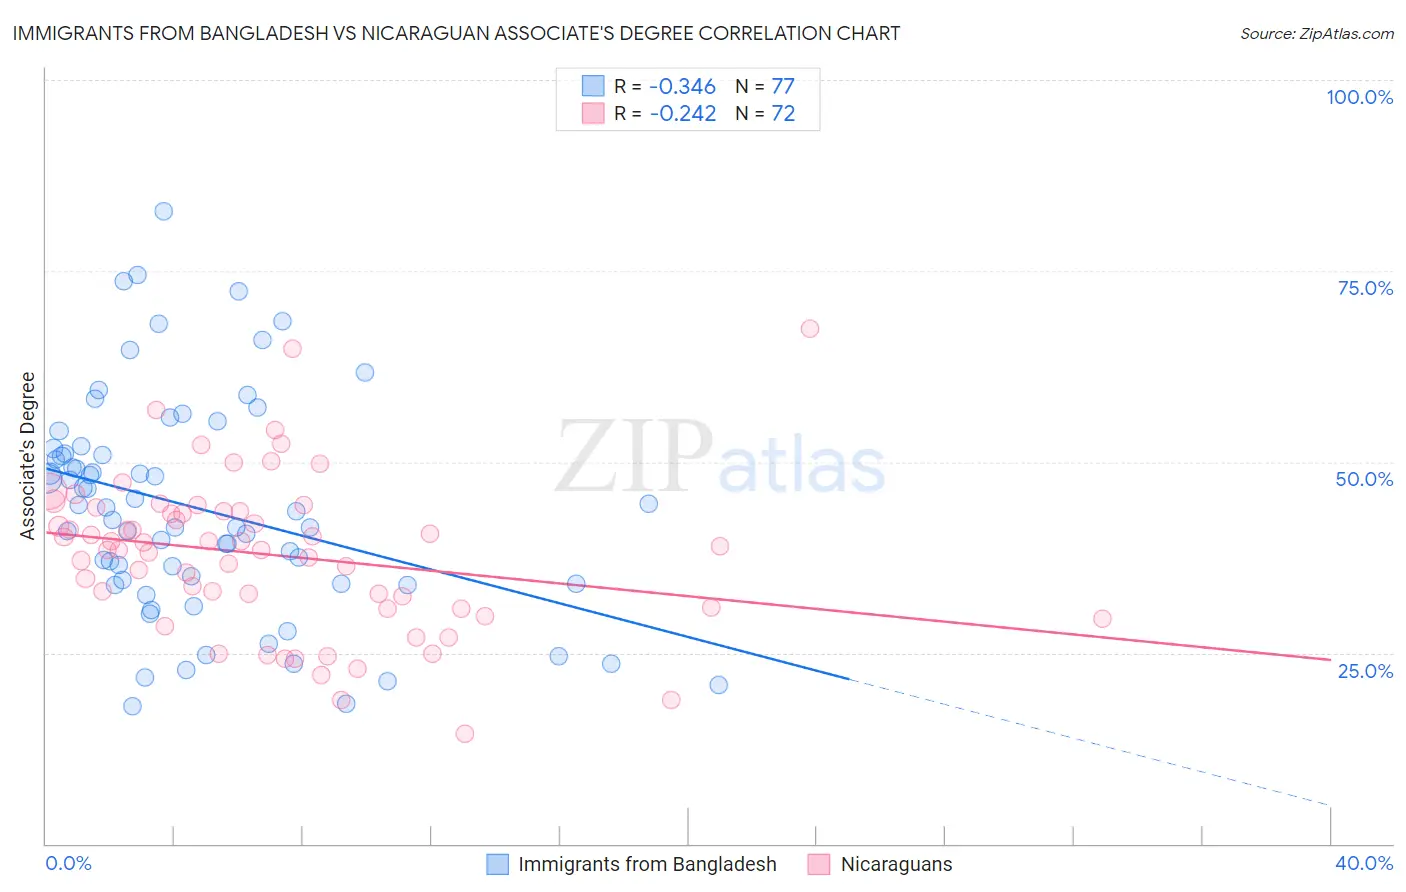
Immigrants from Bangladesh vs Nicaraguan Associate's Degree Correlation Chart
The statistical analysis conducted on geographies consisting of 203,673,511 people shows a mild negative correlation between the proportion of Immigrants from Bangladesh and percentage of population with at least associate's degree education in the United States with a correlation coefficient (R) of -0.346 and weighted average of 45.2%. Similarly, the statistical analysis conducted on geographies consisting of 285,707,386 people shows a weak negative correlation between the proportion of Nicaraguans and percentage of population with at least associate's degree education in the United States with a correlation coefficient (R) of -0.242 and weighted average of 41.5%, a difference of 9.0%.
Associate's Degree Correlation Summary
| Measurement | Immigrants from Bangladesh | Nicaraguan |
| Minimum | 18.0% | 14.4% |
| Maximum | 82.8% | 67.4% |
| Range | 64.8% | 53.0% |
| Mean | 43.9% | 37.8% |
| Median | 43.6% | 38.7% |
| Interquartile 25% (IQ1) | 34.0% | 30.9% |
| Interquartile 75% (IQ3) | 51.4% | 43.6% |
| Interquartile Range (IQR) | 17.4% | 12.7% |
| Standard Deviation (Sample) | 14.3% | 10.2% |
| Standard Deviation (Population) | 14.2% | 10.1% |
Similar Demographics by Associate's Degree
Demographics Similar to Immigrants from Bangladesh by Associate's Degree
In terms of associate's degree, the demographic groups most similar to Immigrants from Bangladesh are Immigrants from Senegal (45.2%, a difference of 0.020%), Senegalese (45.2%, a difference of 0.030%), Immigrants from Vietnam (45.2%, a difference of 0.060%), Scotch-Irish (45.3%, a difference of 0.10%), and Spaniard (45.2%, a difference of 0.11%).
| Demographics | Rating | Rank | Associate's Degree |
| Koreans | 33.8 /100 | #191 | Fair 45.8% |
| Celtics | 33.3 /100 | #192 | Fair 45.8% |
| Immigrants | Cameroon | 31.0 /100 | #193 | Fair 45.7% |
| Immigrants | Peru | 27.6 /100 | #194 | Fair 45.5% |
| Germans | 26.5 /100 | #195 | Fair 45.5% |
| French | 25.6 /100 | #196 | Fair 45.4% |
| Scotch-Irish | 22.3 /100 | #197 | Fair 45.3% |
| Immigrants | Bangladesh | 21.3 /100 | #198 | Fair 45.2% |
| Immigrants | Senegal | 21.2 /100 | #199 | Fair 45.2% |
| Senegalese | 21.1 /100 | #200 | Fair 45.2% |
| Immigrants | Vietnam | 20.8 /100 | #201 | Fair 45.2% |
| Spaniards | 20.4 /100 | #202 | Fair 45.2% |
| Immigrants | South Eastern Asia | 20.2 /100 | #203 | Fair 45.2% |
| Nigerians | 19.1 /100 | #204 | Poor 45.1% |
| Immigrants | Thailand | 18.9 /100 | #205 | Poor 45.1% |
Demographics Similar to Nicaraguans by Associate's Degree
In terms of associate's degree, the demographic groups most similar to Nicaraguans are Bahamian (41.5%, a difference of 0.090%), Immigrants from Jamaica (41.5%, a difference of 0.11%), Osage (41.5%, a difference of 0.12%), Marshallese (41.6%, a difference of 0.13%), and Malaysian (41.6%, a difference of 0.32%).
| Demographics | Rating | Rank | Associate's Degree |
| Cubans | 0.6 /100 | #254 | Tragic 41.9% |
| Immigrants | Guyana | 0.5 /100 | #255 | Tragic 41.8% |
| Immigrants | Congo | 0.5 /100 | #256 | Tragic 41.8% |
| Spanish Americans | 0.5 /100 | #257 | Tragic 41.8% |
| Japanese | 0.5 /100 | #258 | Tragic 41.7% |
| Malaysians | 0.4 /100 | #259 | Tragic 41.6% |
| Marshallese | 0.4 /100 | #260 | Tragic 41.6% |
| Nicaraguans | 0.4 /100 | #261 | Tragic 41.5% |
| Bahamians | 0.4 /100 | #262 | Tragic 41.5% |
| Immigrants | Jamaica | 0.3 /100 | #263 | Tragic 41.5% |
| Osage | 0.3 /100 | #264 | Tragic 41.5% |
| Africans | 0.2 /100 | #265 | Tragic 41.1% |
| Samoans | 0.2 /100 | #266 | Tragic 41.1% |
| Hawaiians | 0.2 /100 | #267 | Tragic 40.9% |
| Central American Indians | 0.2 /100 | #268 | Tragic 40.8% |