Immigrants from Bangladesh vs Bermudan Currently Married
COMPARE
Immigrants from Bangladesh
Bermudan
Currently Married
Currently Married Comparison
Immigrants from Bangladesh
Bermudans
43.6%
CURRENTLY MARRIED
0.1/ 100
METRIC RATING
265th/ 347
METRIC RANK
43.5%
CURRENTLY MARRIED
0.1/ 100
METRIC RATING
271st/ 347
METRIC RANK
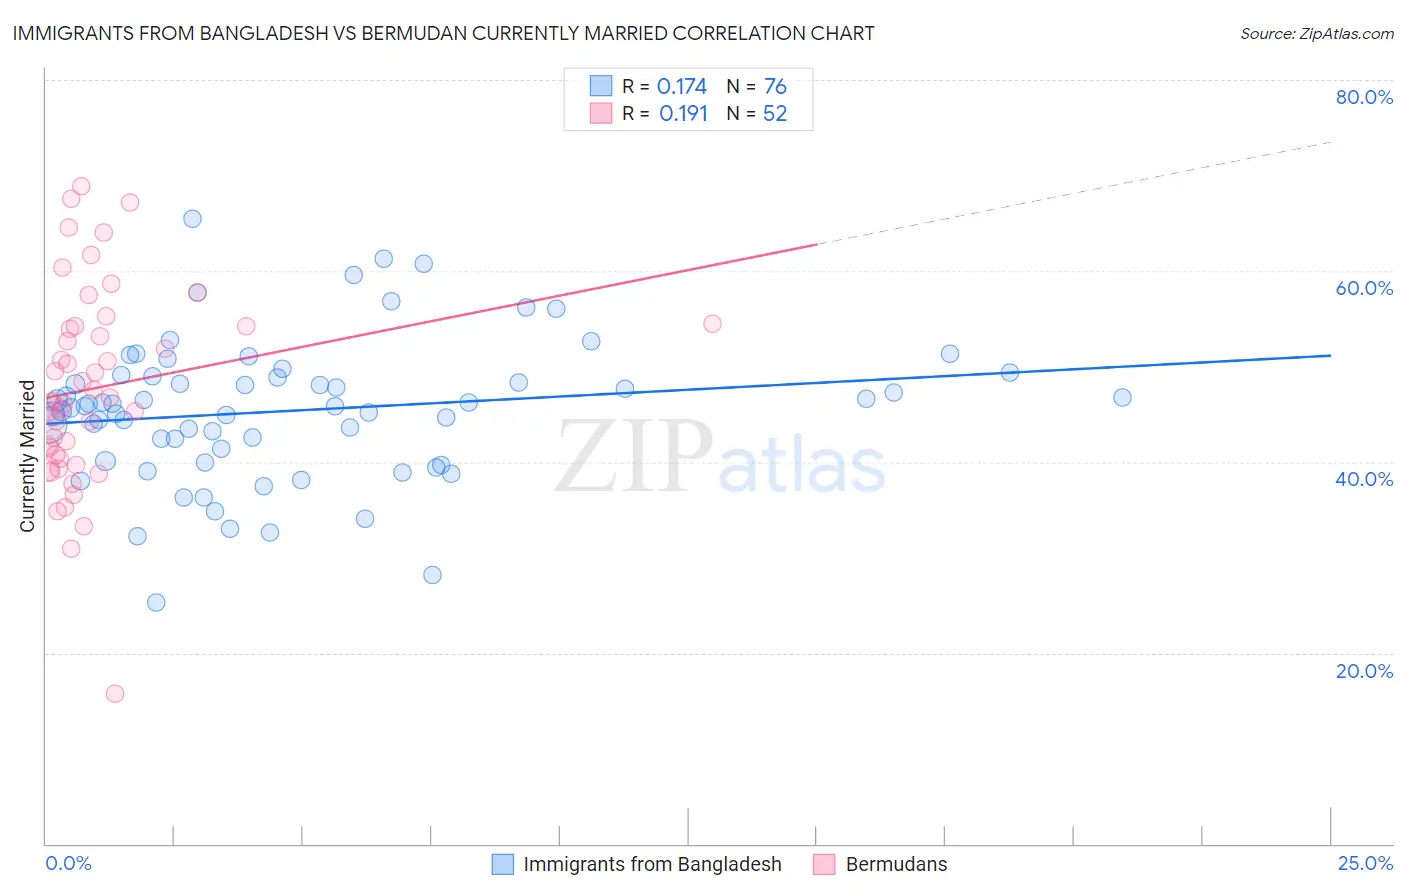
Immigrants from Bangladesh vs Bermudan Currently Married Correlation Chart
The statistical analysis conducted on geographies consisting of 203,666,210 people shows a poor positive correlation between the proportion of Immigrants from Bangladesh and percentage of population currently married in the United States with a correlation coefficient (R) of 0.174 and weighted average of 43.6%. Similarly, the statistical analysis conducted on geographies consisting of 55,732,325 people shows a poor positive correlation between the proportion of Bermudans and percentage of population currently married in the United States with a correlation coefficient (R) of 0.191 and weighted average of 43.5%, a difference of 0.32%.
Currently Married Correlation Summary
| Measurement | Immigrants from Bangladesh | Bermudan |
| Minimum | 25.3% | 15.7% |
| Maximum | 65.5% | 68.9% |
| Range | 40.2% | 53.2% |
| Mean | 45.4% | 47.7% |
| Median | 45.8% | 46.6% |
| Interquartile 25% (IQ1) | 40.7% | 40.5% |
| Interquartile 75% (IQ3) | 48.9% | 54.2% |
| Interquartile Range (IQR) | 8.2% | 13.7% |
| Standard Deviation (Sample) | 7.4% | 10.4% |
| Standard Deviation (Population) | 7.3% | 10.3% |
Demographics Similar to Immigrants from Bangladesh and Bermudans by Currently Married
In terms of currently married, the demographic groups most similar to Immigrants from Bangladesh are Ecuadorian (43.6%, a difference of 0.070%), Sudanese (43.7%, a difference of 0.080%), Immigrants from Cuba (43.7%, a difference of 0.10%), Immigrants from Eritrea (43.6%, a difference of 0.10%), and Spanish American Indian (43.6%, a difference of 0.10%). Similarly, the demographic groups most similar to Bermudans are Salvadoran (43.5%, a difference of 0.020%), Indonesian (43.5%, a difference of 0.040%), Yaqui (43.4%, a difference of 0.080%), Immigrants from Sudan (43.5%, a difference of 0.090%), and Nigerian (43.4%, a difference of 0.10%).
| Demographics | Rating | Rank | Currently Married |
| Ute | 0.2 /100 | #258 | Tragic 43.9% |
| Immigrants | Sierra Leone | 0.1 /100 | #259 | Tragic 43.8% |
| Immigrants | Latin America | 0.1 /100 | #260 | Tragic 43.8% |
| Immigrants | Nicaragua | 0.1 /100 | #261 | Tragic 43.7% |
| Bangladeshis | 0.1 /100 | #262 | Tragic 43.7% |
| Immigrants | Cuba | 0.1 /100 | #263 | Tragic 43.7% |
| Sudanese | 0.1 /100 | #264 | Tragic 43.7% |
| Immigrants | Bangladesh | 0.1 /100 | #265 | Tragic 43.6% |
| Ecuadorians | 0.1 /100 | #266 | Tragic 43.6% |
| Immigrants | Eritrea | 0.1 /100 | #267 | Tragic 43.6% |
| Spanish American Indians | 0.1 /100 | #268 | Tragic 43.6% |
| Immigrants | Sudan | 0.1 /100 | #269 | Tragic 43.5% |
| Salvadorans | 0.1 /100 | #270 | Tragic 43.5% |
| Bermudans | 0.1 /100 | #271 | Tragic 43.5% |
| Indonesians | 0.1 /100 | #272 | Tragic 43.5% |
| Yaqui | 0.1 /100 | #273 | Tragic 43.4% |
| Nigerians | 0.1 /100 | #274 | Tragic 43.4% |
| Colville | 0.1 /100 | #275 | Tragic 43.4% |
| Sierra Leoneans | 0.1 /100 | #276 | Tragic 43.4% |
| Immigrants | Nigeria | 0.1 /100 | #277 | Tragic 43.4% |
| Central Americans | 0.0 /100 | #278 | Tragic 43.3% |