Czechoslovakian vs Slovak Associate's Degree
COMPARE
Czechoslovakian
Slovak
Associate's Degree
Associate's Degree Comparison
Czechoslovakians
Slovaks
46.0%
ASSOCIATE'S DEGREE
40.0/ 100
METRIC RATING
184th/ 347
METRIC RANK
46.3%
ASSOCIATE'S DEGREE
48.4/ 100
METRIC RATING
177th/ 347
METRIC RANK
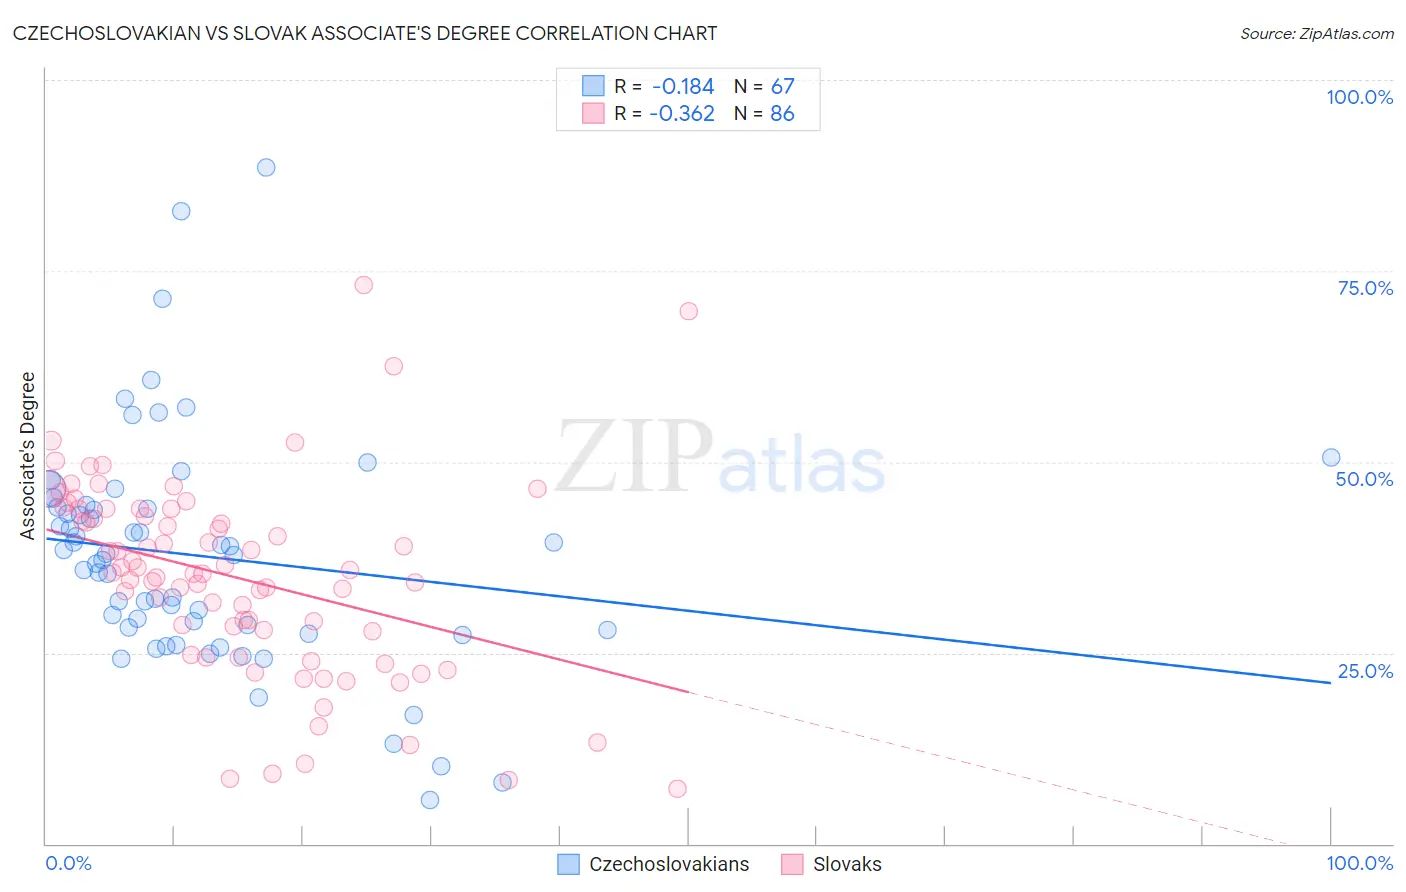
Czechoslovakian vs Slovak Associate's Degree Correlation Chart
The statistical analysis conducted on geographies consisting of 368,660,591 people shows a poor negative correlation between the proportion of Czechoslovakians and percentage of population with at least associate's degree education in the United States with a correlation coefficient (R) of -0.184 and weighted average of 46.0%. Similarly, the statistical analysis conducted on geographies consisting of 397,875,693 people shows a mild negative correlation between the proportion of Slovaks and percentage of population with at least associate's degree education in the United States with a correlation coefficient (R) of -0.362 and weighted average of 46.3%, a difference of 0.64%.
Associate's Degree Correlation Summary
| Measurement | Czechoslovakian | Slovak |
| Minimum | 5.7% | 7.1% |
| Maximum | 88.6% | 73.2% |
| Range | 82.8% | 66.0% |
| Mean | 37.6% | 34.9% |
| Median | 37.8% | 35.4% |
| Interquartile 25% (IQ1) | 28.0% | 27.8% |
| Interquartile 75% (IQ3) | 44.1% | 43.8% |
| Interquartile Range (IQR) | 16.1% | 16.1% |
| Standard Deviation (Sample) | 15.1% | 12.8% |
| Standard Deviation (Population) | 15.0% | 12.7% |
Demographics Similar to Czechoslovakians and Slovaks by Associate's Degree
In terms of associate's degree, the demographic groups most similar to Czechoslovakians are Yugoslavian (46.0%, a difference of 0.020%), Swiss (46.0%, a difference of 0.030%), Immigrants from Colombia (46.0%, a difference of 0.10%), Costa Rican (46.0%, a difference of 0.11%), and Welsh (45.9%, a difference of 0.17%). Similarly, the demographic groups most similar to Slovaks are Finnish (46.3%, a difference of 0.010%), Immigrants from Bosnia and Herzegovina (46.3%, a difference of 0.010%), Belgian (46.3%, a difference of 0.040%), Sri Lankan (46.3%, a difference of 0.060%), and English (46.4%, a difference of 0.12%).
| Demographics | Rating | Rank | Associate's Degree |
| Irish | 53.6 /100 | #170 | Average 46.5% |
| Basques | 52.8 /100 | #171 | Average 46.5% |
| Peruvians | 50.5 /100 | #172 | Average 46.4% |
| Immigrants | Iraq | 50.3 /100 | #173 | Average 46.4% |
| English | 50.0 /100 | #174 | Average 46.4% |
| Belgians | 48.9 /100 | #175 | Average 46.3% |
| Finns | 48.5 /100 | #176 | Average 46.3% |
| Slovaks | 48.4 /100 | #177 | Average 46.3% |
| Immigrants | Bosnia and Herzegovina | 48.3 /100 | #178 | Average 46.3% |
| Sri Lankans | 47.6 /100 | #179 | Average 46.3% |
| Bermudans | 46.4 /100 | #180 | Average 46.2% |
| Immigrants | Colombia | 41.3 /100 | #181 | Average 46.0% |
| Swiss | 40.4 /100 | #182 | Average 46.0% |
| Yugoslavians | 40.2 /100 | #183 | Average 46.0% |
| Czechoslovakians | 40.0 /100 | #184 | Average 46.0% |
| Costa Ricans | 38.6 /100 | #185 | Fair 46.0% |
| Welsh | 37.9 /100 | #186 | Fair 45.9% |
| Immigrants | Uruguay | 35.5 /100 | #187 | Fair 45.8% |
| Ghanaians | 35.5 /100 | #188 | Fair 45.8% |
| Immigrants | Oceania | 34.7 /100 | #189 | Fair 45.8% |
| Vietnamese | 34.0 /100 | #190 | Fair 45.8% |