Immigrants from the Azores vs Immigrants from Jamaica Kindergarten
COMPARE
Immigrants from the Azores
Immigrants from Jamaica
Kindergarten
Kindergarten Comparison
Immigrants from the Azores
Immigrants from Jamaica
97.0%
KINDERGARTEN
0.0/ 100
METRIC RATING
310th/ 347
METRIC RANK
97.5%
KINDERGARTEN
0.2/ 100
METRIC RATING
270th/ 347
METRIC RANK
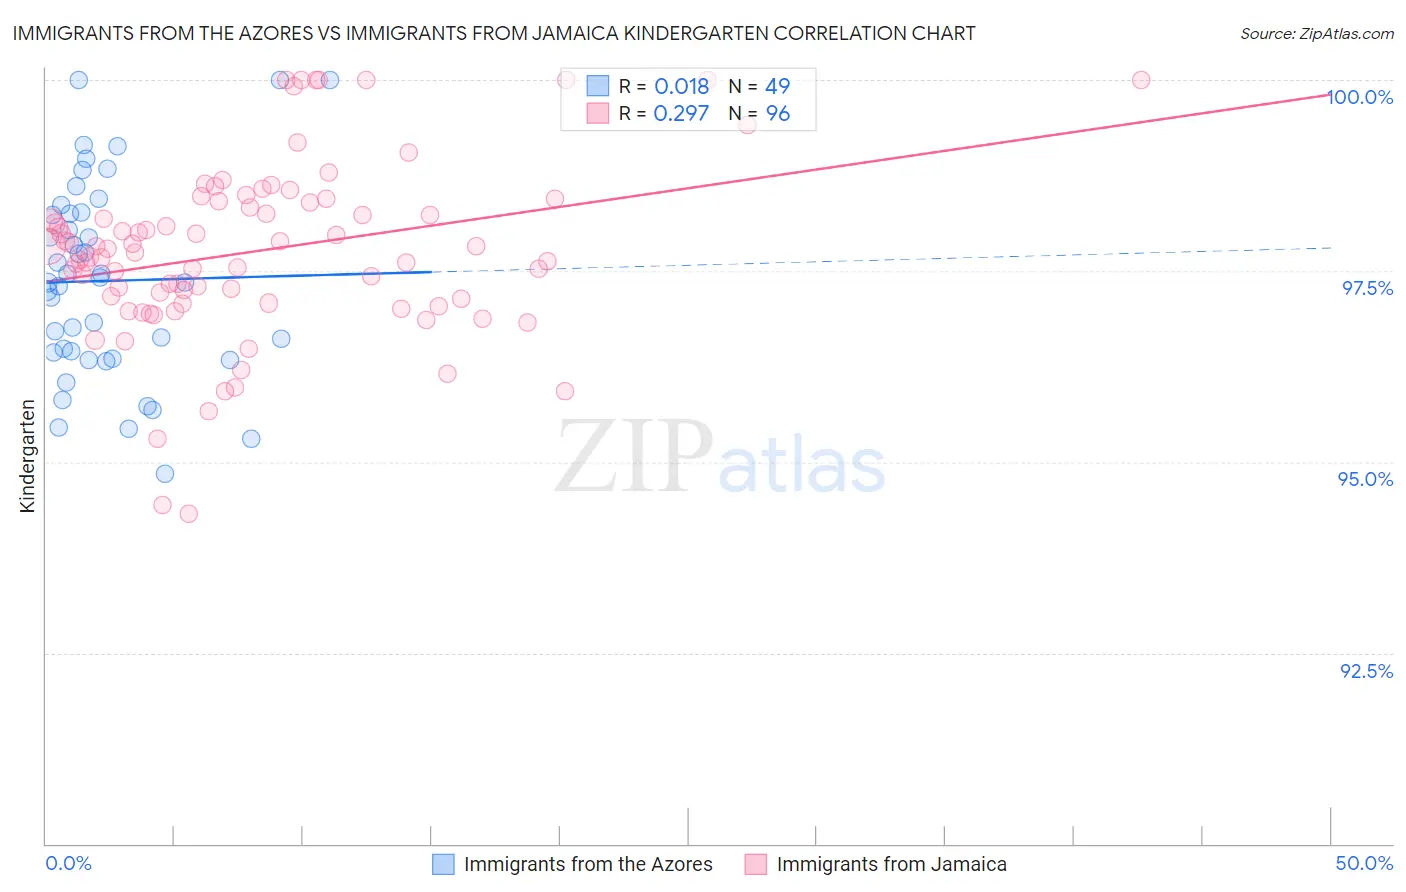
Immigrants from the Azores vs Immigrants from Jamaica Kindergarten Correlation Chart
The statistical analysis conducted on geographies consisting of 46,257,310 people shows no correlation between the proportion of Immigrants from the Azores and percentage of population with at least kindergarten education in the United States with a correlation coefficient (R) of 0.018 and weighted average of 97.0%. Similarly, the statistical analysis conducted on geographies consisting of 301,830,081 people shows a weak positive correlation between the proportion of Immigrants from Jamaica and percentage of population with at least kindergarten education in the United States with a correlation coefficient (R) of 0.297 and weighted average of 97.5%, a difference of 0.55%.
Kindergarten Correlation Summary
| Measurement | Immigrants from the Azores | Immigrants from Jamaica |
| Minimum | 94.8% | 94.3% |
| Maximum | 100.0% | 100.0% |
| Range | 5.2% | 5.7% |
| Mean | 97.4% | 97.8% |
| Median | 97.4% | 97.8% |
| Interquartile 25% (IQ1) | 96.4% | 97.1% |
| Interquartile 75% (IQ3) | 98.3% | 98.4% |
| Interquartile Range (IQR) | 1.9% | 1.3% |
| Standard Deviation (Sample) | 1.3% | 1.1% |
| Standard Deviation (Population) | 1.3% | 1.1% |
Similar Demographics by Kindergarten
Demographics Similar to Immigrants from the Azores by Kindergarten
In terms of kindergarten, the demographic groups most similar to Immigrants from the Azores are Immigrants from Haiti (97.0%, a difference of 0.0%), Sri Lankan (97.0%, a difference of 0.0%), Immigrants from Somalia (97.0%, a difference of 0.010%), Hispanic or Latino (97.0%, a difference of 0.020%), and Guyanese (96.9%, a difference of 0.020%).
| Demographics | Rating | Rank | Kindergarten |
| Somalis | 0.0 /100 | #303 | Tragic 97.0% |
| Nicaraguans | 0.0 /100 | #304 | Tragic 97.0% |
| Ecuadorians | 0.0 /100 | #305 | Tragic 97.0% |
| Belizeans | 0.0 /100 | #306 | Tragic 97.0% |
| Hispanics or Latinos | 0.0 /100 | #307 | Tragic 97.0% |
| Immigrants | Somalia | 0.0 /100 | #308 | Tragic 97.0% |
| Immigrants | Haiti | 0.0 /100 | #309 | Tragic 97.0% |
| Immigrants | Azores | 0.0 /100 | #310 | Tragic 97.0% |
| Sri Lankans | 0.0 /100 | #311 | Tragic 97.0% |
| Guyanese | 0.0 /100 | #312 | Tragic 96.9% |
| Cape Verdeans | 0.0 /100 | #313 | Tragic 96.9% |
| Hondurans | 0.0 /100 | #314 | Tragic 96.9% |
| Immigrants | Belize | 0.0 /100 | #315 | Tragic 96.9% |
| Immigrants | Nicaragua | 0.0 /100 | #316 | Tragic 96.9% |
| Immigrants | Ecuador | 0.0 /100 | #317 | Tragic 96.9% |
Demographics Similar to Immigrants from Jamaica by Kindergarten
In terms of kindergarten, the demographic groups most similar to Immigrants from Jamaica are West Indian (97.5%, a difference of 0.020%), Immigrants from Peru (97.5%, a difference of 0.020%), Immigrants from Bolivia (97.5%, a difference of 0.020%), Cuban (97.5%, a difference of 0.030%), and Immigrants from Sierra Leone (97.5%, a difference of 0.030%).
| Demographics | Rating | Rank | Kindergarten |
| Immigrants | South America | 0.4 /100 | #263 | Tragic 97.5% |
| Assyrians/Chaldeans/Syriacs | 0.4 /100 | #264 | Tragic 97.5% |
| Cubans | 0.3 /100 | #265 | Tragic 97.5% |
| Immigrants | Sierra Leone | 0.3 /100 | #266 | Tragic 97.5% |
| Immigrants | Liberia | 0.3 /100 | #267 | Tragic 97.5% |
| Immigrants | Nigeria | 0.3 /100 | #268 | Tragic 97.5% |
| West Indians | 0.3 /100 | #269 | Tragic 97.5% |
| Immigrants | Jamaica | 0.2 /100 | #270 | Tragic 97.5% |
| Immigrants | Peru | 0.2 /100 | #271 | Tragic 97.5% |
| Immigrants | Bolivia | 0.2 /100 | #272 | Tragic 97.5% |
| Immigrants | China | 0.1 /100 | #273 | Tragic 97.4% |
| Immigrants | Cameroon | 0.1 /100 | #274 | Tragic 97.4% |
| Ghanaians | 0.1 /100 | #275 | Tragic 97.4% |
| Immigrants | Philippines | 0.1 /100 | #276 | Tragic 97.4% |
| Immigrants | Western Africa | 0.1 /100 | #277 | Tragic 97.4% |