Immigrants from the Azores vs Filipino Kindergarten
COMPARE
Immigrants from the Azores
Filipino
Kindergarten
Kindergarten Comparison
Immigrants from the Azores
Filipinos
97.0%
KINDERGARTEN
0.0/ 100
METRIC RATING
310th/ 347
METRIC RANK
98.0%
KINDERGARTEN
78.3/ 100
METRIC RATING
146th/ 347
METRIC RANK
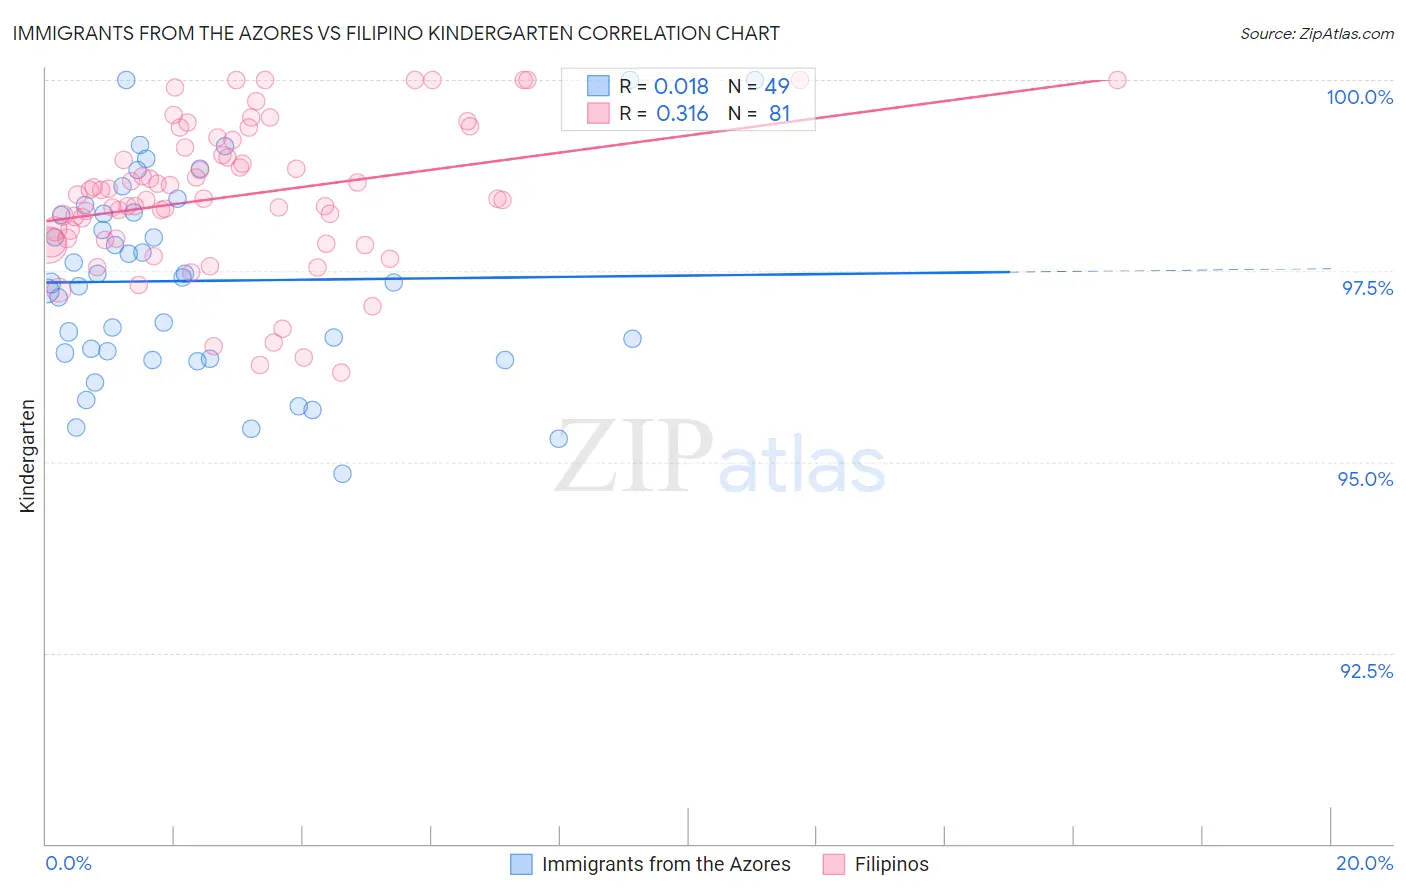
Immigrants from the Azores vs Filipino Kindergarten Correlation Chart
The statistical analysis conducted on geographies consisting of 46,257,310 people shows no correlation between the proportion of Immigrants from the Azores and percentage of population with at least kindergarten education in the United States with a correlation coefficient (R) of 0.018 and weighted average of 97.0%. Similarly, the statistical analysis conducted on geographies consisting of 254,351,427 people shows a mild positive correlation between the proportion of Filipinos and percentage of population with at least kindergarten education in the United States with a correlation coefficient (R) of 0.316 and weighted average of 98.0%, a difference of 1.1%.
Kindergarten Correlation Summary
| Measurement | Immigrants from the Azores | Filipino |
| Minimum | 94.8% | 96.2% |
| Maximum | 100.0% | 100.0% |
| Range | 5.2% | 3.8% |
| Mean | 97.4% | 98.5% |
| Median | 97.4% | 98.4% |
| Interquartile 25% (IQ1) | 96.4% | 97.9% |
| Interquartile 75% (IQ3) | 98.3% | 99.2% |
| Interquartile Range (IQR) | 1.9% | 1.3% |
| Standard Deviation (Sample) | 1.3% | 0.94% |
| Standard Deviation (Population) | 1.3% | 0.94% |
Similar Demographics by Kindergarten
Demographics Similar to Immigrants from the Azores by Kindergarten
In terms of kindergarten, the demographic groups most similar to Immigrants from the Azores are Immigrants from Haiti (97.0%, a difference of 0.0%), Sri Lankan (97.0%, a difference of 0.0%), Immigrants from Somalia (97.0%, a difference of 0.010%), Hispanic or Latino (97.0%, a difference of 0.020%), and Guyanese (96.9%, a difference of 0.020%).
| Demographics | Rating | Rank | Kindergarten |
| Somalis | 0.0 /100 | #303 | Tragic 97.0% |
| Nicaraguans | 0.0 /100 | #304 | Tragic 97.0% |
| Ecuadorians | 0.0 /100 | #305 | Tragic 97.0% |
| Belizeans | 0.0 /100 | #306 | Tragic 97.0% |
| Hispanics or Latinos | 0.0 /100 | #307 | Tragic 97.0% |
| Immigrants | Somalia | 0.0 /100 | #308 | Tragic 97.0% |
| Immigrants | Haiti | 0.0 /100 | #309 | Tragic 97.0% |
| Immigrants | Azores | 0.0 /100 | #310 | Tragic 97.0% |
| Sri Lankans | 0.0 /100 | #311 | Tragic 97.0% |
| Guyanese | 0.0 /100 | #312 | Tragic 96.9% |
| Cape Verdeans | 0.0 /100 | #313 | Tragic 96.9% |
| Hondurans | 0.0 /100 | #314 | Tragic 96.9% |
| Immigrants | Belize | 0.0 /100 | #315 | Tragic 96.9% |
| Immigrants | Nicaragua | 0.0 /100 | #316 | Tragic 96.9% |
| Immigrants | Ecuador | 0.0 /100 | #317 | Tragic 96.9% |
Demographics Similar to Filipinos by Kindergarten
In terms of kindergarten, the demographic groups most similar to Filipinos are Hmong (98.1%, a difference of 0.0%), Immigrants from Israel (98.0%, a difference of 0.0%), Alsatian (98.1%, a difference of 0.010%), Apache (98.0%, a difference of 0.010%), and Immigrants from Greece (98.0%, a difference of 0.010%).
| Demographics | Rating | Rank | Kindergarten |
| Israelis | 87.7 /100 | #139 | Excellent 98.1% |
| Palestinians | 83.6 /100 | #140 | Excellent 98.1% |
| Marshallese | 83.0 /100 | #141 | Excellent 98.1% |
| Immigrants | Turkey | 82.8 /100 | #142 | Excellent 98.1% |
| Burmese | 81.5 /100 | #143 | Excellent 98.1% |
| Alsatians | 80.4 /100 | #144 | Excellent 98.1% |
| Hmong | 78.8 /100 | #145 | Good 98.1% |
| Filipinos | 78.3 /100 | #146 | Good 98.0% |
| Immigrants | Israel | 77.6 /100 | #147 | Good 98.0% |
| Apache | 75.0 /100 | #148 | Good 98.0% |
| Immigrants | Greece | 74.9 /100 | #149 | Good 98.0% |
| Jordanians | 72.8 /100 | #150 | Good 98.0% |
| Soviet Union | 70.8 /100 | #151 | Good 98.0% |
| Dutch West Indians | 70.1 /100 | #152 | Good 98.0% |
| Immigrants | Moldova | 69.1 /100 | #153 | Good 98.0% |