Immigrants from Cabo Verde vs Immigrants from Jamaica Kindergarten
COMPARE
Immigrants from Cabo Verde
Immigrants from Jamaica
Kindergarten
Kindergarten Comparison
Immigrants from Cabo Verde
Immigrants from Jamaica
96.4%
KINDERGARTEN
0.0/ 100
METRIC RATING
341st/ 347
METRIC RANK
97.5%
KINDERGARTEN
0.2/ 100
METRIC RATING
270th/ 347
METRIC RANK
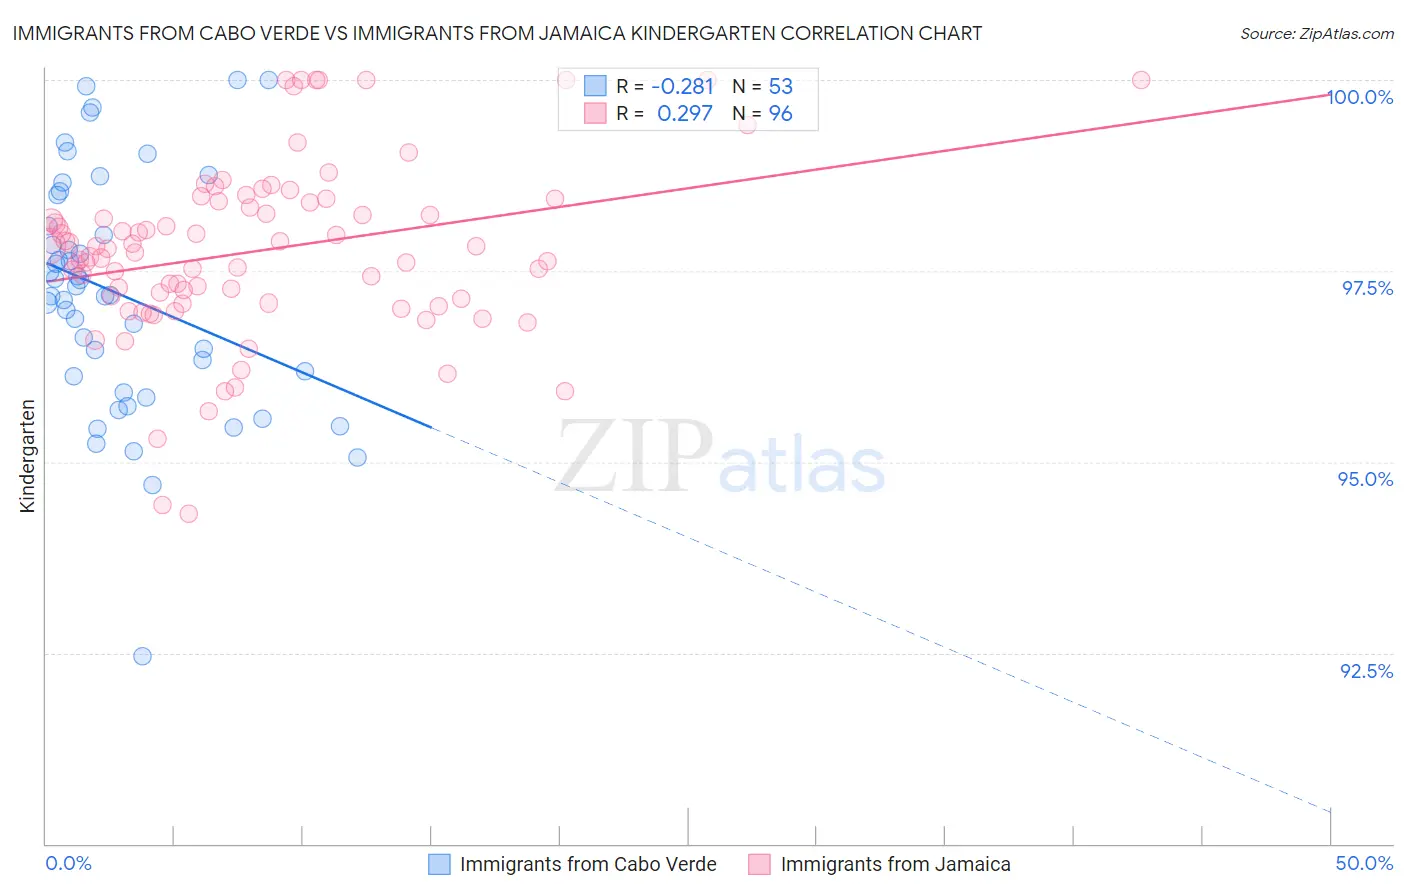
Immigrants from Cabo Verde vs Immigrants from Jamaica Kindergarten Correlation Chart
The statistical analysis conducted on geographies consisting of 38,158,666 people shows a weak negative correlation between the proportion of Immigrants from Cabo Verde and percentage of population with at least kindergarten education in the United States with a correlation coefficient (R) of -0.281 and weighted average of 96.4%. Similarly, the statistical analysis conducted on geographies consisting of 301,830,081 people shows a weak positive correlation between the proportion of Immigrants from Jamaica and percentage of population with at least kindergarten education in the United States with a correlation coefficient (R) of 0.297 and weighted average of 97.5%, a difference of 1.1%.
Kindergarten Correlation Summary
| Measurement | Immigrants from Cabo Verde | Immigrants from Jamaica |
| Minimum | 92.5% | 94.3% |
| Maximum | 100.0% | 100.0% |
| Range | 7.5% | 5.7% |
| Mean | 97.2% | 97.8% |
| Median | 97.2% | 97.8% |
| Interquartile 25% (IQ1) | 96.0% | 97.1% |
| Interquartile 75% (IQ3) | 98.3% | 98.4% |
| Interquartile Range (IQR) | 2.3% | 1.3% |
| Standard Deviation (Sample) | 1.5% | 1.1% |
| Standard Deviation (Population) | 1.5% | 1.1% |
Similar Demographics by Kindergarten
Demographics Similar to Immigrants from Cabo Verde by Kindergarten
In terms of kindergarten, the demographic groups most similar to Immigrants from Cabo Verde are Immigrants from Central America (96.4%, a difference of 0.0%), Immigrants from Mexico (96.4%, a difference of 0.020%), Immigrants from Guatemala (96.4%, a difference of 0.040%), Salvadoran (96.3%, a difference of 0.060%), and Immigrants from Cambodia (96.5%, a difference of 0.12%).
| Demographics | Rating | Rank | Kindergarten |
| Central Americans | 0.0 /100 | #333 | Tragic 96.6% |
| Immigrants | Dominican Republic | 0.0 /100 | #334 | Tragic 96.6% |
| Bangladeshis | 0.0 /100 | #335 | Tragic 96.6% |
| Guatemalans | 0.0 /100 | #336 | Tragic 96.5% |
| Immigrants | Cambodia | 0.0 /100 | #337 | Tragic 96.5% |
| Immigrants | Fiji | 0.0 /100 | #338 | Tragic 96.5% |
| Immigrants | Guatemala | 0.0 /100 | #339 | Tragic 96.4% |
| Immigrants | Central America | 0.0 /100 | #340 | Tragic 96.4% |
| Immigrants | Cabo Verde | 0.0 /100 | #341 | Tragic 96.4% |
| Immigrants | Mexico | 0.0 /100 | #342 | Tragic 96.4% |
| Salvadorans | 0.0 /100 | #343 | Tragic 96.3% |
| Nepalese | 0.0 /100 | #344 | Tragic 96.2% |
| Immigrants | El Salvador | 0.0 /100 | #345 | Tragic 96.2% |
| Immigrants | Yemen | 0.0 /100 | #346 | Tragic 95.9% |
| Spanish American Indians | 0.0 /100 | #347 | Tragic 95.8% |
Demographics Similar to Immigrants from Jamaica by Kindergarten
In terms of kindergarten, the demographic groups most similar to Immigrants from Jamaica are West Indian (97.5%, a difference of 0.020%), Immigrants from Peru (97.5%, a difference of 0.020%), Immigrants from Bolivia (97.5%, a difference of 0.020%), Cuban (97.5%, a difference of 0.030%), and Immigrants from Sierra Leone (97.5%, a difference of 0.030%).
| Demographics | Rating | Rank | Kindergarten |
| Immigrants | South America | 0.4 /100 | #263 | Tragic 97.5% |
| Assyrians/Chaldeans/Syriacs | 0.4 /100 | #264 | Tragic 97.5% |
| Cubans | 0.3 /100 | #265 | Tragic 97.5% |
| Immigrants | Sierra Leone | 0.3 /100 | #266 | Tragic 97.5% |
| Immigrants | Liberia | 0.3 /100 | #267 | Tragic 97.5% |
| Immigrants | Nigeria | 0.3 /100 | #268 | Tragic 97.5% |
| West Indians | 0.3 /100 | #269 | Tragic 97.5% |
| Immigrants | Jamaica | 0.2 /100 | #270 | Tragic 97.5% |
| Immigrants | Peru | 0.2 /100 | #271 | Tragic 97.5% |
| Immigrants | Bolivia | 0.2 /100 | #272 | Tragic 97.5% |
| Immigrants | China | 0.1 /100 | #273 | Tragic 97.4% |
| Immigrants | Cameroon | 0.1 /100 | #274 | Tragic 97.4% |
| Ghanaians | 0.1 /100 | #275 | Tragic 97.4% |
| Immigrants | Philippines | 0.1 /100 | #276 | Tragic 97.4% |
| Immigrants | Western Africa | 0.1 /100 | #277 | Tragic 97.4% |