Immigrants from the Azores vs Tohono O'odham Kindergarten
COMPARE
Immigrants from the Azores
Tohono O'odham
Kindergarten
Kindergarten Comparison
Immigrants from the Azores
Tohono O'odham
97.0%
KINDERGARTEN
0.0/ 100
METRIC RATING
310th/ 347
METRIC RANK
97.9%
KINDERGARTEN
24.6/ 100
METRIC RATING
198th/ 347
METRIC RANK
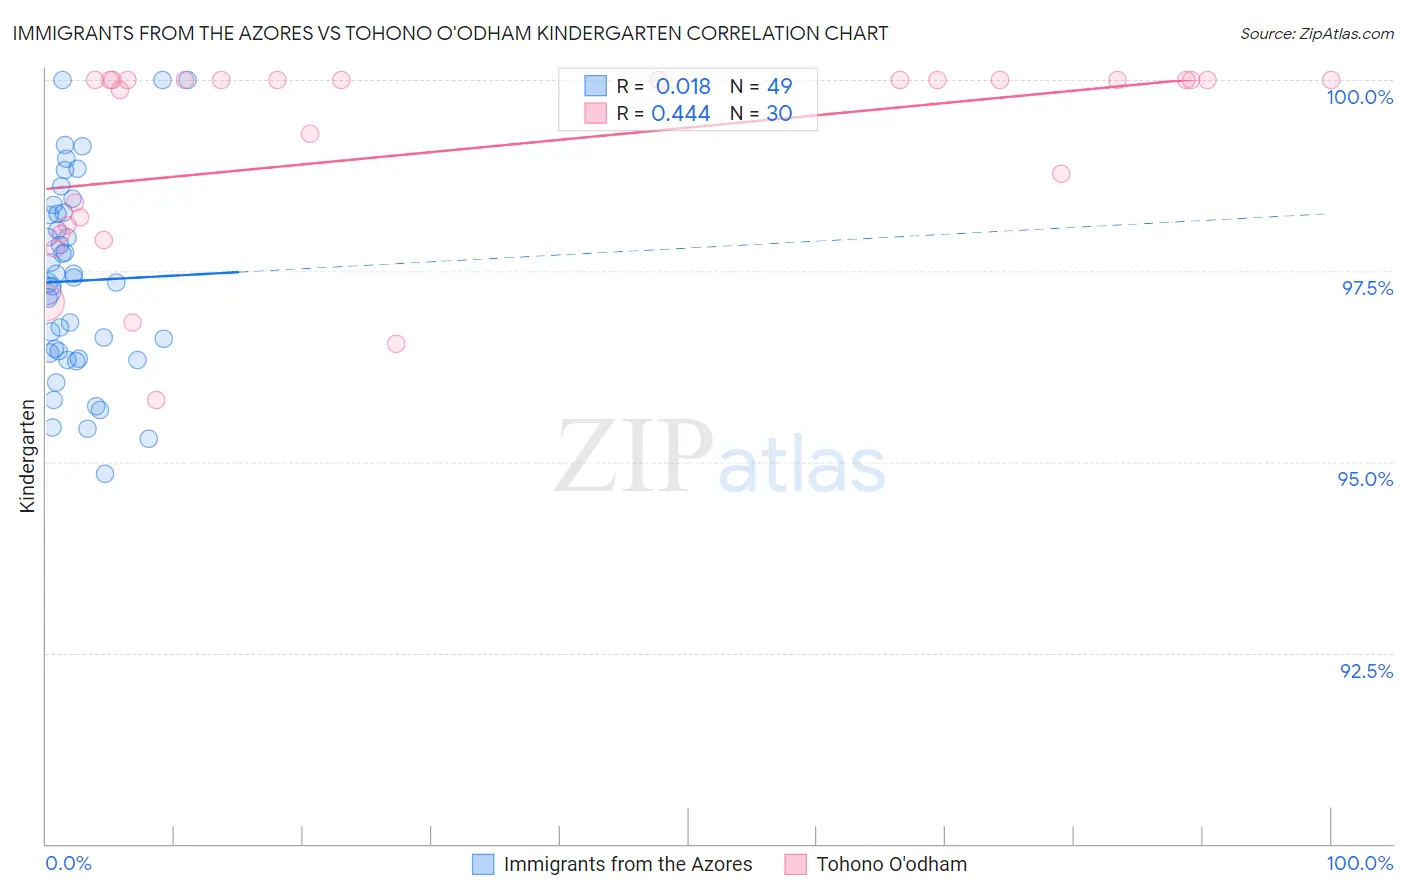
Immigrants from the Azores vs Tohono O'odham Kindergarten Correlation Chart
The statistical analysis conducted on geographies consisting of 46,257,310 people shows no correlation between the proportion of Immigrants from the Azores and percentage of population with at least kindergarten education in the United States with a correlation coefficient (R) of 0.018 and weighted average of 97.0%. Similarly, the statistical analysis conducted on geographies consisting of 58,723,100 people shows a moderate positive correlation between the proportion of Tohono O'odham and percentage of population with at least kindergarten education in the United States with a correlation coefficient (R) of 0.444 and weighted average of 97.9%, a difference of 0.94%.
Kindergarten Correlation Summary
| Measurement | Immigrants from the Azores | Tohono O'odham |
| Minimum | 94.8% | 95.8% |
| Maximum | 100.0% | 100.0% |
| Range | 5.2% | 4.2% |
| Mean | 97.4% | 99.1% |
| Median | 97.4% | 100.0% |
| Interquartile 25% (IQ1) | 96.4% | 98.1% |
| Interquartile 75% (IQ3) | 98.3% | 100.0% |
| Interquartile Range (IQR) | 1.9% | 1.9% |
| Standard Deviation (Sample) | 1.3% | 1.3% |
| Standard Deviation (Population) | 1.3% | 1.3% |
Similar Demographics by Kindergarten
Demographics Similar to Immigrants from the Azores by Kindergarten
In terms of kindergarten, the demographic groups most similar to Immigrants from the Azores are Immigrants from Haiti (97.0%, a difference of 0.0%), Sri Lankan (97.0%, a difference of 0.0%), Immigrants from Somalia (97.0%, a difference of 0.010%), Hispanic or Latino (97.0%, a difference of 0.020%), and Guyanese (96.9%, a difference of 0.020%).
| Demographics | Rating | Rank | Kindergarten |
| Somalis | 0.0 /100 | #303 | Tragic 97.0% |
| Nicaraguans | 0.0 /100 | #304 | Tragic 97.0% |
| Ecuadorians | 0.0 /100 | #305 | Tragic 97.0% |
| Belizeans | 0.0 /100 | #306 | Tragic 97.0% |
| Hispanics or Latinos | 0.0 /100 | #307 | Tragic 97.0% |
| Immigrants | Somalia | 0.0 /100 | #308 | Tragic 97.0% |
| Immigrants | Haiti | 0.0 /100 | #309 | Tragic 97.0% |
| Immigrants | Azores | 0.0 /100 | #310 | Tragic 97.0% |
| Sri Lankans | 0.0 /100 | #311 | Tragic 97.0% |
| Guyanese | 0.0 /100 | #312 | Tragic 96.9% |
| Cape Verdeans | 0.0 /100 | #313 | Tragic 96.9% |
| Hondurans | 0.0 /100 | #314 | Tragic 96.9% |
| Immigrants | Belize | 0.0 /100 | #315 | Tragic 96.9% |
| Immigrants | Nicaragua | 0.0 /100 | #316 | Tragic 96.9% |
| Immigrants | Ecuador | 0.0 /100 | #317 | Tragic 96.9% |
Demographics Similar to Tohono O'odham by Kindergarten
In terms of kindergarten, the demographic groups most similar to Tohono O'odham are Immigrants from Kenya (97.9%, a difference of 0.0%), Guamanian/Chamorro (97.9%, a difference of 0.010%), Immigrants from Egypt (97.9%, a difference of 0.010%), Yuman (97.9%, a difference of 0.010%), and Immigrants from Taiwan (97.9%, a difference of 0.020%).
| Demographics | Rating | Rank | Kindergarten |
| Immigrants | Taiwan | 30.7 /100 | #191 | Fair 97.9% |
| Blacks/African Americans | 29.9 /100 | #192 | Fair 97.9% |
| Paraguayans | 29.6 /100 | #193 | Fair 97.9% |
| Hawaiians | 29.3 /100 | #194 | Fair 97.9% |
| Mongolians | 28.9 /100 | #195 | Fair 97.9% |
| Guamanians/Chamorros | 26.2 /100 | #196 | Fair 97.9% |
| Immigrants | Kenya | 25.5 /100 | #197 | Fair 97.9% |
| Tohono O'odham | 24.6 /100 | #198 | Fair 97.9% |
| Immigrants | Egypt | 22.3 /100 | #199 | Fair 97.9% |
| Yuman | 21.6 /100 | #200 | Fair 97.9% |
| Immigrants | Lebanon | 20.9 /100 | #201 | Fair 97.9% |
| Immigrants | Ukraine | 19.1 /100 | #202 | Poor 97.8% |
| Immigrants | Uganda | 18.8 /100 | #203 | Poor 97.8% |
| Immigrants | Chile | 18.1 /100 | #204 | Poor 97.8% |
| Immigrants | Southern Europe | 18.0 /100 | #205 | Poor 97.8% |