Immigrants from Austria vs Australian Nursery School
COMPARE
Immigrants from Austria
Australian
Nursery School
Nursery School Comparison
Immigrants from Austria
Australians
98.4%
NURSERY SCHOOL
99.6/ 100
METRIC RATING
69th/ 347
METRIC RANK
98.5%
NURSERY SCHOOL
99.8/ 100
METRIC RATING
52nd/ 347
METRIC RANK
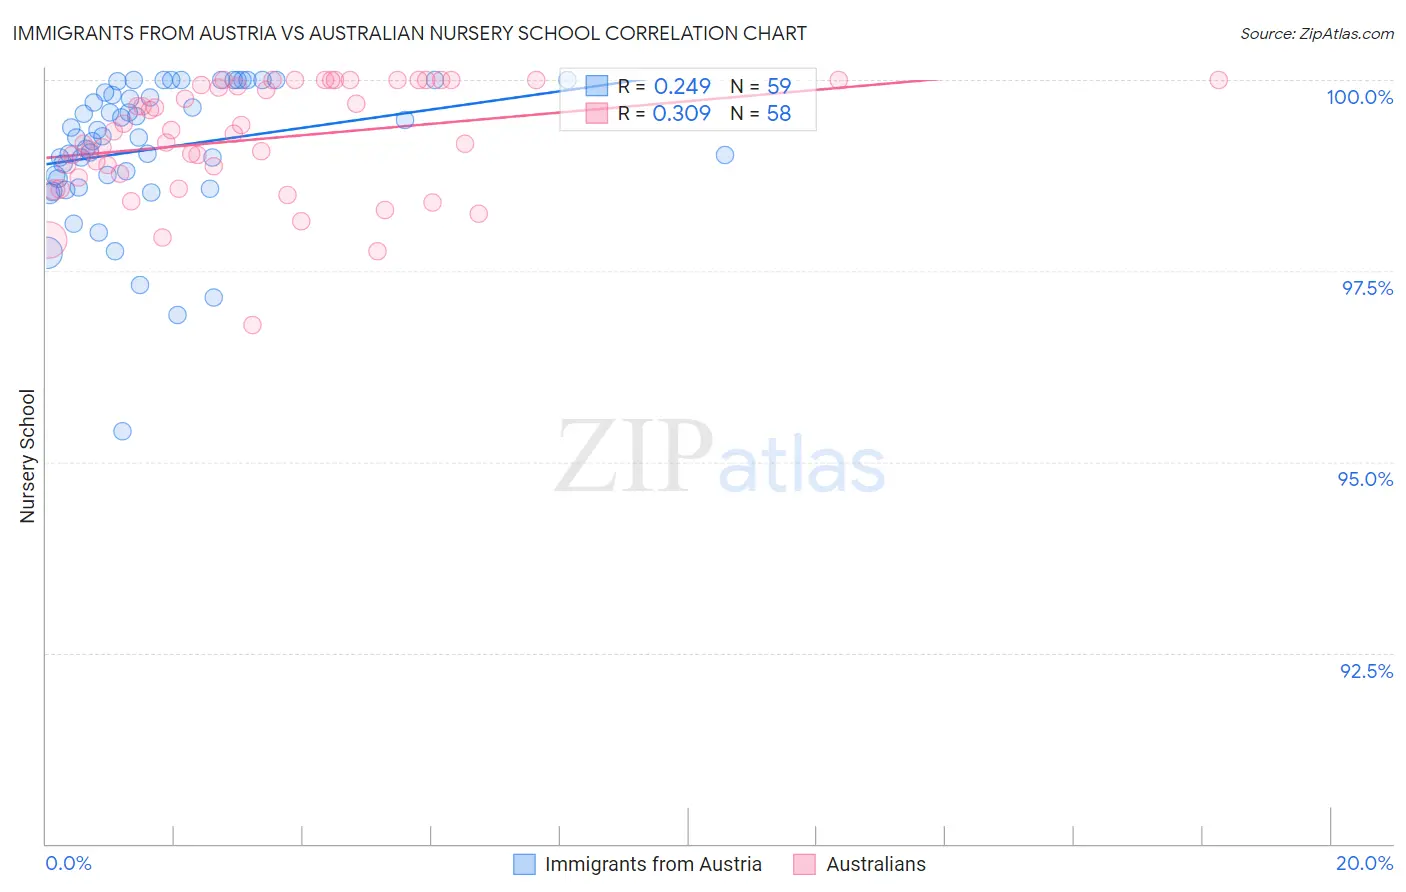
Immigrants from Austria vs Australian Nursery School Correlation Chart
The statistical analysis conducted on geographies consisting of 167,973,800 people shows a weak positive correlation between the proportion of Immigrants from Austria and percentage of population with at least nursery school education in the United States with a correlation coefficient (R) of 0.249 and weighted average of 98.4%. Similarly, the statistical analysis conducted on geographies consisting of 224,153,392 people shows a mild positive correlation between the proportion of Australians and percentage of population with at least nursery school education in the United States with a correlation coefficient (R) of 0.309 and weighted average of 98.5%, a difference of 0.060%.
Nursery School Correlation Summary
| Measurement | Immigrants from Austria | Australian |
| Minimum | 95.4% | 96.8% |
| Maximum | 100.0% | 100.0% |
| Range | 4.6% | 3.2% |
| Mean | 99.1% | 99.2% |
| Median | 99.2% | 99.3% |
| Interquartile 25% (IQ1) | 98.7% | 98.8% |
| Interquartile 75% (IQ3) | 99.8% | 100.0% |
| Interquartile Range (IQR) | 1.1% | 1.2% |
| Standard Deviation (Sample) | 0.92% | 0.74% |
| Standard Deviation (Population) | 0.91% | 0.73% |
Demographics Similar to Immigrants from Austria and Australians by Nursery School
In terms of nursery school, the demographic groups most similar to Immigrants from Austria are Immigrants from Northern Europe (98.4%, a difference of 0.0%), Russian (98.4%, a difference of 0.0%), Cheyenne (98.4%, a difference of 0.0%), Canadian (98.4%, a difference of 0.010%), and Immigrants from North America (98.4%, a difference of 0.020%). Similarly, the demographic groups most similar to Australians are Celtic (98.5%, a difference of 0.0%), Estonian (98.5%, a difference of 0.0%), Kiowa (98.4%, a difference of 0.010%), Pueblo (98.4%, a difference of 0.010%), and Immigrants from Scotland (98.4%, a difference of 0.010%).
| Demographics | Rating | Rank | Nursery School |
| Celtics | 99.8 /100 | #50 | Exceptional 98.5% |
| Estonians | 99.8 /100 | #51 | Exceptional 98.5% |
| Australians | 99.8 /100 | #52 | Exceptional 98.5% |
| Kiowa | 99.8 /100 | #53 | Exceptional 98.4% |
| Pueblo | 99.8 /100 | #54 | Exceptional 98.4% |
| Immigrants | Scotland | 99.8 /100 | #55 | Exceptional 98.4% |
| Americans | 99.8 /100 | #56 | Exceptional 98.4% |
| Austrians | 99.8 /100 | #57 | Exceptional 98.4% |
| Bulgarians | 99.8 /100 | #58 | Exceptional 98.4% |
| Immigrants | Canada | 99.8 /100 | #59 | Exceptional 98.4% |
| Slavs | 99.8 /100 | #60 | Exceptional 98.4% |
| New Zealanders | 99.7 /100 | #61 | Exceptional 98.4% |
| Creek | 99.7 /100 | #62 | Exceptional 98.4% |
| Immigrants | North America | 99.7 /100 | #63 | Exceptional 98.4% |
| Greeks | 99.7 /100 | #64 | Exceptional 98.4% |
| Maltese | 99.7 /100 | #65 | Exceptional 98.4% |
| Canadians | 99.7 /100 | #66 | Exceptional 98.4% |
| Immigrants | Northern Europe | 99.6 /100 | #67 | Exceptional 98.4% |
| Russians | 99.6 /100 | #68 | Exceptional 98.4% |
| Immigrants | Austria | 99.6 /100 | #69 | Exceptional 98.4% |
| Cheyenne | 99.6 /100 | #70 | Exceptional 98.4% |