Immigrants from Australia vs Ukrainian Bachelor's Degree
COMPARE
Immigrants from Australia
Ukrainian
Bachelor's Degree
Bachelor's Degree Comparison
Immigrants from Australia
Ukrainians
48.5%
BACHELOR'S DEGREE
100.0/ 100
METRIC RATING
11th/ 347
METRIC RANK
40.9%
BACHELOR'S DEGREE
96.6/ 100
METRIC RATING
108th/ 347
METRIC RANK
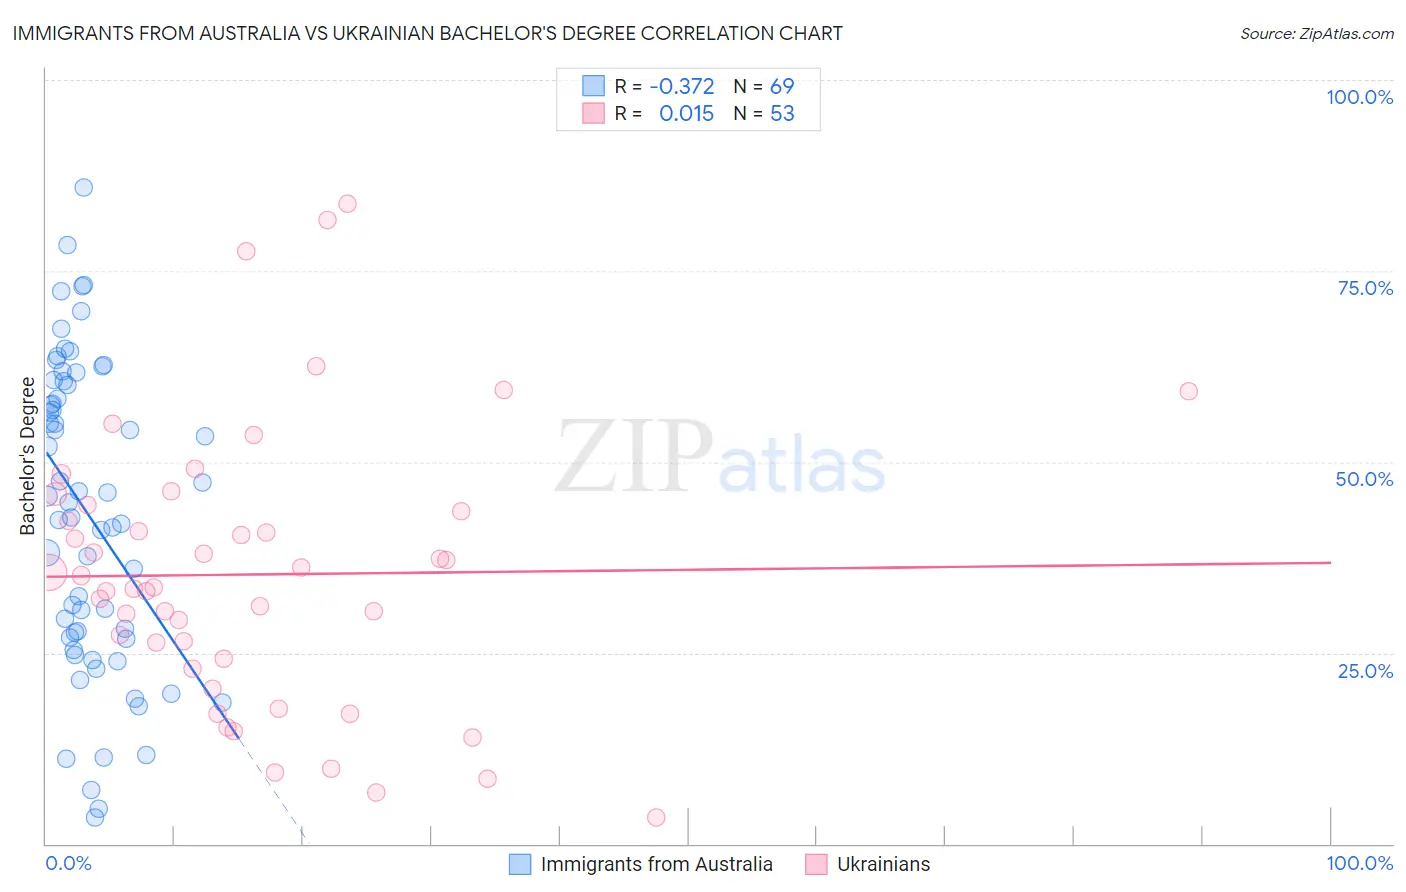
Immigrants from Australia vs Ukrainian Bachelor's Degree Correlation Chart
The statistical analysis conducted on geographies consisting of 227,197,750 people shows a mild negative correlation between the proportion of Immigrants from Australia and percentage of population with at least bachelor's degree education in the United States with a correlation coefficient (R) of -0.372 and weighted average of 48.5%. Similarly, the statistical analysis conducted on geographies consisting of 448,644,466 people shows no correlation between the proportion of Ukrainians and percentage of population with at least bachelor's degree education in the United States with a correlation coefficient (R) of 0.015 and weighted average of 40.9%, a difference of 18.6%.
Bachelor's Degree Correlation Summary
| Measurement | Immigrants from Australia | Ukrainian |
| Minimum | 3.4% | 3.4% |
| Maximum | 85.9% | 83.8% |
| Range | 82.5% | 80.3% |
| Mean | 43.1% | 35.3% |
| Median | 44.7% | 33.6% |
| Interquartile 25% (IQ1) | 27.0% | 23.6% |
| Interquartile 75% (IQ3) | 60.3% | 43.9% |
| Interquartile Range (IQR) | 33.3% | 20.3% |
| Standard Deviation (Sample) | 19.9% | 18.0% |
| Standard Deviation (Population) | 19.8% | 17.8% |
Similar Demographics by Bachelor's Degree
Demographics Similar to Immigrants from Australia by Bachelor's Degree
In terms of bachelor's degree, the demographic groups most similar to Immigrants from Australia are Immigrants from China (48.4%, a difference of 0.18%), Immigrants from South Central Asia (48.3%, a difference of 0.32%), Immigrants from Hong Kong (48.2%, a difference of 0.60%), Immigrants from Eastern Asia (48.1%, a difference of 0.74%), and Cypriot (49.0%, a difference of 1.1%).
| Demographics | Rating | Rank | Bachelor's Degree |
| Immigrants | Taiwan | 100.0 /100 | #4 | Exceptional 51.2% |
| Iranians | 100.0 /100 | #5 | Exceptional 51.0% |
| Okinawans | 100.0 /100 | #6 | Exceptional 50.5% |
| Immigrants | Iran | 100.0 /100 | #7 | Exceptional 50.3% |
| Thais | 100.0 /100 | #8 | Exceptional 50.1% |
| Immigrants | Israel | 100.0 /100 | #9 | Exceptional 50.0% |
| Cypriots | 100.0 /100 | #10 | Exceptional 49.0% |
| Immigrants | Australia | 100.0 /100 | #11 | Exceptional 48.5% |
| Immigrants | China | 100.0 /100 | #12 | Exceptional 48.4% |
| Immigrants | South Central Asia | 100.0 /100 | #13 | Exceptional 48.3% |
| Immigrants | Hong Kong | 100.0 /100 | #14 | Exceptional 48.2% |
| Immigrants | Eastern Asia | 100.0 /100 | #15 | Exceptional 48.1% |
| Soviet Union | 100.0 /100 | #16 | Exceptional 47.9% |
| Eastern Europeans | 100.0 /100 | #17 | Exceptional 47.5% |
| Indians (Asian) | 100.0 /100 | #18 | Exceptional 47.4% |
Demographics Similar to Ukrainians by Bachelor's Degree
In terms of bachelor's degree, the demographic groups most similar to Ukrainians are Arab (40.9%, a difference of 0.020%), Albanian (40.9%, a difference of 0.090%), Northern European (41.0%, a difference of 0.14%), Immigrants from Chile (40.8%, a difference of 0.14%), and Ugandan (40.8%, a difference of 0.19%).
| Demographics | Rating | Rank | Bachelor's Degree |
| Immigrants | Morocco | 98.0 /100 | #101 | Exceptional 41.4% |
| Immigrants | Italy | 97.8 /100 | #102 | Exceptional 41.3% |
| Chileans | 97.5 /100 | #103 | Exceptional 41.2% |
| Jordanians | 97.4 /100 | #104 | Exceptional 41.2% |
| Syrians | 97.4 /100 | #105 | Exceptional 41.1% |
| Alsatians | 97.0 /100 | #106 | Exceptional 41.0% |
| Northern Europeans | 96.8 /100 | #107 | Exceptional 41.0% |
| Ukrainians | 96.6 /100 | #108 | Exceptional 40.9% |
| Arabs | 96.6 /100 | #109 | Exceptional 40.9% |
| Albanians | 96.5 /100 | #110 | Exceptional 40.9% |
| Immigrants | Chile | 96.4 /100 | #111 | Exceptional 40.8% |
| Ugandans | 96.3 /100 | #112 | Exceptional 40.8% |
| Brazilians | 96.3 /100 | #113 | Exceptional 40.8% |
| Afghans | 96.2 /100 | #114 | Exceptional 40.8% |
| Palestinians | 95.8 /100 | #115 | Exceptional 40.7% |