Irish vs Hmong GED/Equivalency
COMPARE
Irish
Hmong
GED/Equivalency
GED/Equivalency Comparison
Irish
Hmong
87.6%
GED/EQUIVALENCY
98.6/ 100
METRIC RATING
78th/ 347
METRIC RANK
84.9%
GED/EQUIVALENCY
13.1/ 100
METRIC RATING
207th/ 347
METRIC RANK
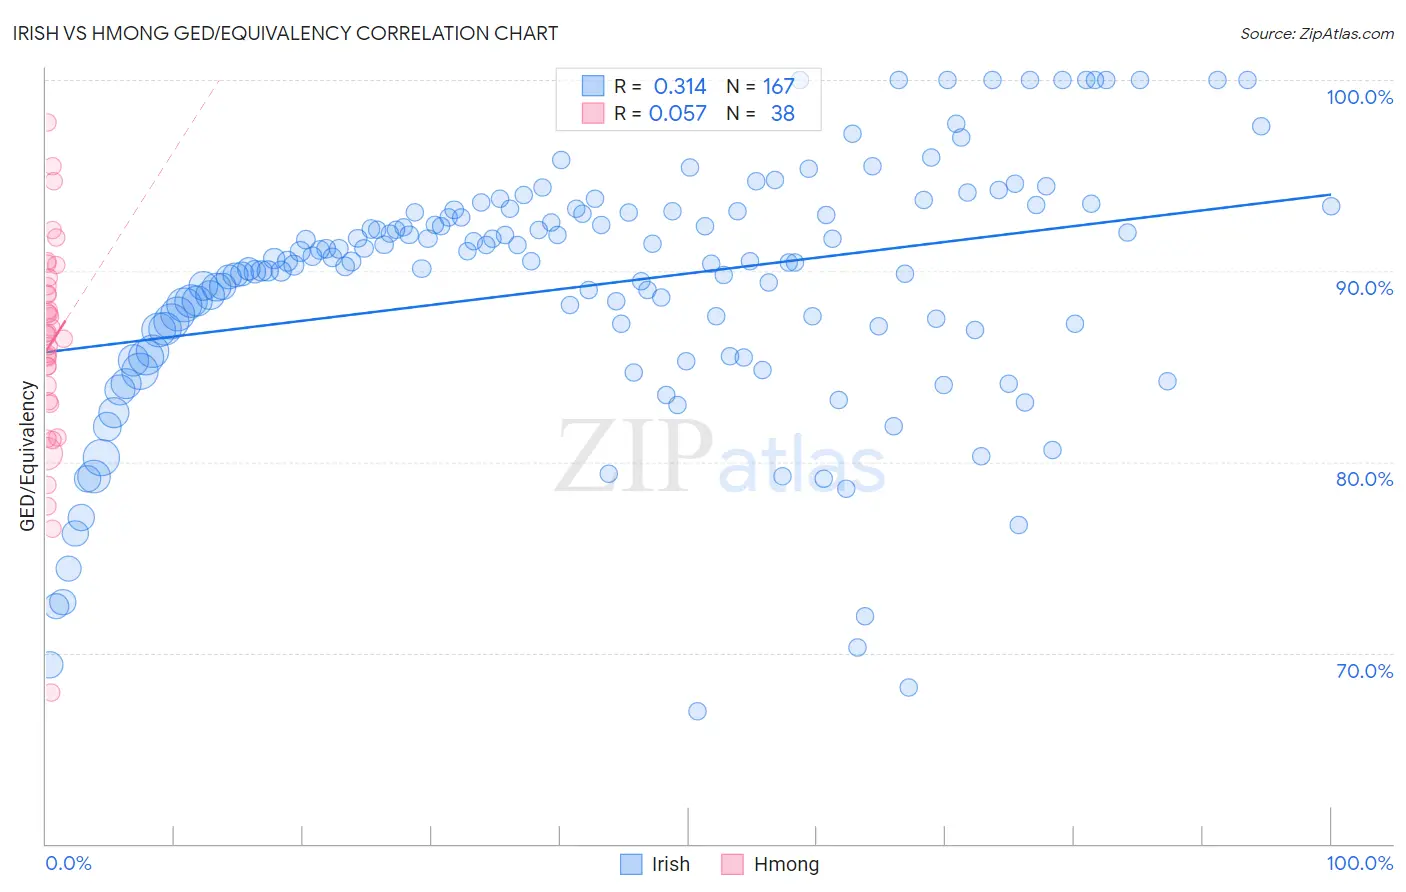
Irish vs Hmong GED/Equivalency Correlation Chart
The statistical analysis conducted on geographies consisting of 580,709,357 people shows a mild positive correlation between the proportion of Irish and percentage of population with at least ged/equivalency education in the United States with a correlation coefficient (R) of 0.314 and weighted average of 87.6%. Similarly, the statistical analysis conducted on geographies consisting of 24,672,093 people shows a slight positive correlation between the proportion of Hmong and percentage of population with at least ged/equivalency education in the United States with a correlation coefficient (R) of 0.057 and weighted average of 84.9%, a difference of 3.2%.
GED/Equivalency Correlation Summary
| Measurement | Irish | Hmong |
| Minimum | 67.0% | 67.9% |
| Maximum | 100.0% | 97.8% |
| Range | 33.0% | 29.9% |
| Mean | 89.2% | 86.1% |
| Median | 90.5% | 86.7% |
| Interquartile 25% (IQ1) | 86.9% | 83.2% |
| Interquartile 75% (IQ3) | 93.1% | 89.2% |
| Interquartile Range (IQR) | 6.2% | 6.0% |
| Standard Deviation (Sample) | 6.6% | 5.6% |
| Standard Deviation (Population) | 6.6% | 5.5% |
Similar Demographics by GED/Equivalency
Demographics Similar to Irish by GED/Equivalency
In terms of ged/equivalency, the demographic groups most similar to Irish are Slavic (87.7%, a difference of 0.020%), Immigrants from Serbia (87.7%, a difference of 0.030%), English (87.6%, a difference of 0.030%), Scottish (87.7%, a difference of 0.040%), and Immigrants from Kuwait (87.7%, a difference of 0.060%).
| Demographics | Rating | Rank | GED/Equivalency |
| Austrians | 98.8 /100 | #71 | Exceptional 87.7% |
| Immigrants | Moldova | 98.8 /100 | #72 | Exceptional 87.7% |
| Belgians | 98.8 /100 | #73 | Exceptional 87.7% |
| Immigrants | Kuwait | 98.8 /100 | #74 | Exceptional 87.7% |
| Scottish | 98.7 /100 | #75 | Exceptional 87.7% |
| Immigrants | Serbia | 98.7 /100 | #76 | Exceptional 87.7% |
| Slavs | 98.7 /100 | #77 | Exceptional 87.7% |
| Irish | 98.6 /100 | #78 | Exceptional 87.6% |
| English | 98.6 /100 | #79 | Exceptional 87.6% |
| Immigrants | England | 98.5 /100 | #80 | Exceptional 87.6% |
| Immigrants | Sri Lanka | 98.3 /100 | #81 | Exceptional 87.5% |
| Romanians | 98.3 /100 | #82 | Exceptional 87.5% |
| South Africans | 98.3 /100 | #83 | Exceptional 87.5% |
| Immigrants | Romania | 98.1 /100 | #84 | Exceptional 87.5% |
| Dutch | 98.1 /100 | #85 | Exceptional 87.5% |
Demographics Similar to Hmong by GED/Equivalency
In terms of ged/equivalency, the demographic groups most similar to Hmong are Samoan (84.9%, a difference of 0.020%), Marshallese (84.9%, a difference of 0.030%), Colombian (84.9%, a difference of 0.040%), Immigrants from Cameroon (84.9%, a difference of 0.050%), and Liberian (85.0%, a difference of 0.060%).
| Demographics | Rating | Rank | GED/Equivalency |
| Uruguayans | 16.0 /100 | #200 | Poor 85.0% |
| Portuguese | 15.9 /100 | #201 | Poor 85.0% |
| Cree | 15.9 /100 | #202 | Poor 85.0% |
| Panamanians | 15.3 /100 | #203 | Poor 85.0% |
| Hawaiians | 15.2 /100 | #204 | Poor 85.0% |
| Liberians | 14.6 /100 | #205 | Poor 85.0% |
| Samoans | 13.7 /100 | #206 | Poor 84.9% |
| Hmong | 13.1 /100 | #207 | Poor 84.9% |
| Marshallese | 12.5 /100 | #208 | Poor 84.9% |
| Colombians | 12.3 /100 | #209 | Poor 84.9% |
| Immigrants | Cameroon | 12.1 /100 | #210 | Poor 84.9% |
| South Americans | 10.9 /100 | #211 | Poor 84.8% |
| Immigrants | Somalia | 10.6 /100 | #212 | Poor 84.8% |
| Immigrants | Philippines | 10.0 /100 | #213 | Poor 84.8% |
| Osage | 9.5 /100 | #214 | Tragic 84.8% |