Immigrants from Argentina vs Laotian 2nd Grade
COMPARE
Immigrants from Argentina
Laotian
2nd Grade
2nd Grade Comparison
Immigrants from Argentina
Laotians
97.8%
2ND GRADE
40.6/ 100
METRIC RATING
185th/ 347
METRIC RANK
97.7%
2ND GRADE
9.9/ 100
METRIC RATING
211th/ 347
METRIC RANK
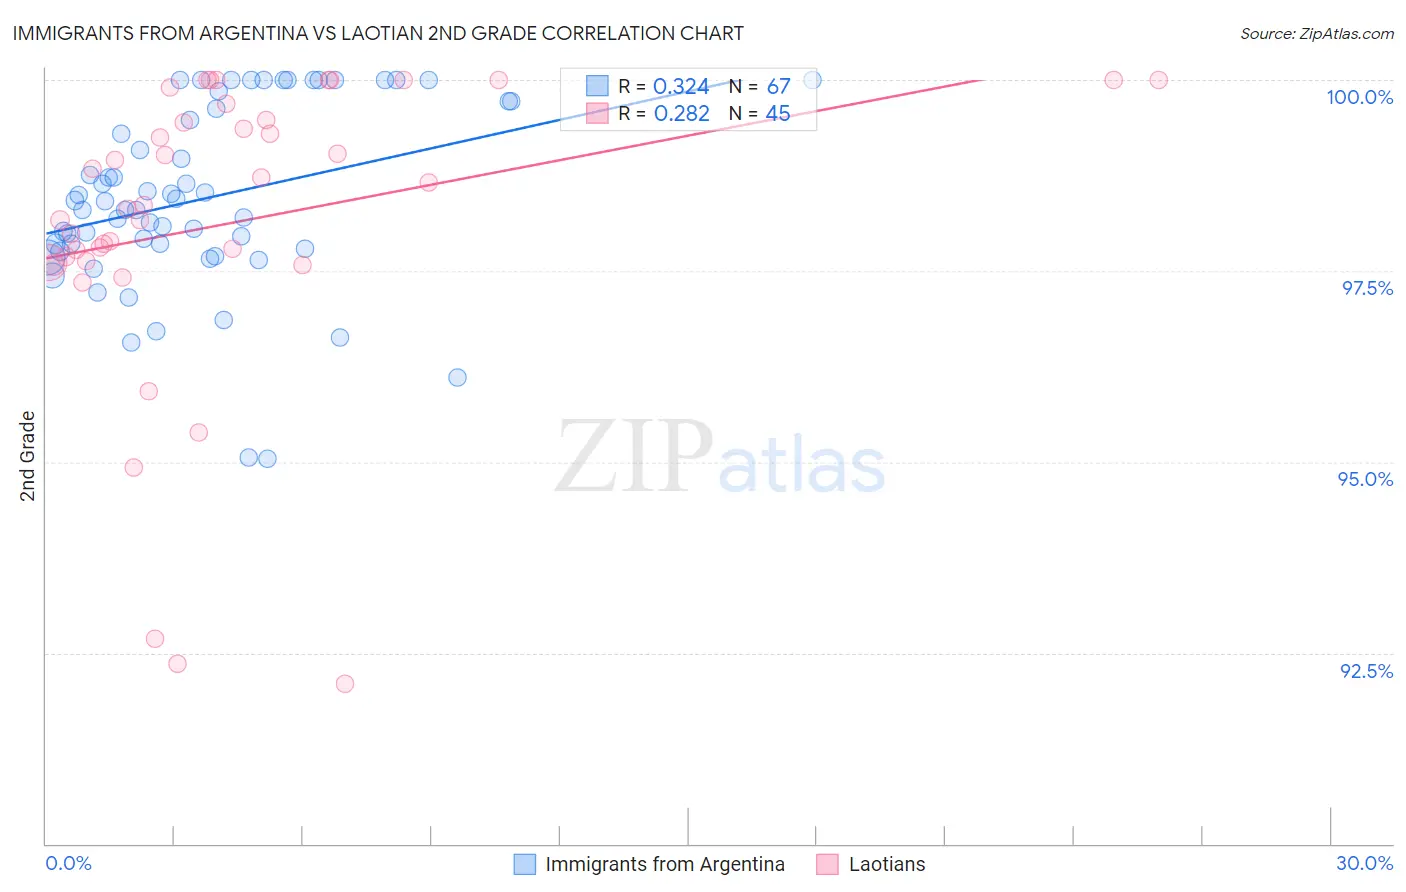
Immigrants from Argentina vs Laotian 2nd Grade Correlation Chart
The statistical analysis conducted on geographies consisting of 264,429,773 people shows a mild positive correlation between the proportion of Immigrants from Argentina and percentage of population with at least 2nd grade education in the United States with a correlation coefficient (R) of 0.324 and weighted average of 97.8%. Similarly, the statistical analysis conducted on geographies consisting of 224,863,064 people shows a weak positive correlation between the proportion of Laotians and percentage of population with at least 2nd grade education in the United States with a correlation coefficient (R) of 0.282 and weighted average of 97.7%, a difference of 0.14%.
2nd Grade Correlation Summary
| Measurement | Immigrants from Argentina | Laotian |
| Minimum | 95.0% | 92.1% |
| Maximum | 100.0% | 100.0% |
| Range | 5.0% | 7.9% |
| Mean | 98.4% | 98.1% |
| Median | 98.4% | 98.4% |
| Interquartile 25% (IQ1) | 97.8% | 97.6% |
| Interquartile 75% (IQ3) | 99.7% | 99.6% |
| Interquartile Range (IQR) | 1.9% | 2.0% |
| Standard Deviation (Sample) | 1.2% | 2.0% |
| Standard Deviation (Population) | 1.2% | 2.0% |
Similar Demographics by 2nd Grade
Demographics Similar to Immigrants from Argentina by 2nd Grade
In terms of 2nd grade, the demographic groups most similar to Immigrants from Argentina are Immigrants from Belarus (97.8%, a difference of 0.0%), Native/Alaskan (97.9%, a difference of 0.010%), Egyptian (97.9%, a difference of 0.010%), Portuguese (97.8%, a difference of 0.010%), and Immigrants from Poland (97.8%, a difference of 0.010%).
| Demographics | Rating | Rank | 2nd Grade |
| Argentineans | 46.3 /100 | #178 | Average 97.9% |
| Immigrants | Venezuela | 46.1 /100 | #179 | Average 97.9% |
| Natives/Alaskans | 44.3 /100 | #180 | Average 97.9% |
| Egyptians | 44.3 /100 | #181 | Average 97.9% |
| Portuguese | 42.4 /100 | #182 | Average 97.8% |
| Immigrants | Poland | 42.2 /100 | #183 | Average 97.8% |
| Immigrants | Belarus | 41.5 /100 | #184 | Average 97.8% |
| Immigrants | Argentina | 40.6 /100 | #185 | Average 97.8% |
| Arabs | 36.9 /100 | #186 | Fair 97.8% |
| Pakistanis | 36.1 /100 | #187 | Fair 97.8% |
| Immigrants | Kazakhstan | 35.6 /100 | #188 | Fair 97.8% |
| Panamanians | 33.5 /100 | #189 | Fair 97.8% |
| Immigrants | Taiwan | 31.8 /100 | #190 | Fair 97.8% |
| Paraguayans | 30.8 /100 | #191 | Fair 97.8% |
| Blacks/African Americans | 29.9 /100 | #192 | Fair 97.8% |
Demographics Similar to Laotians by 2nd Grade
In terms of 2nd grade, the demographic groups most similar to Laotians are Costa Rican (97.7%, a difference of 0.0%), Immigrants from Oceania (97.7%, a difference of 0.010%), Immigrants from Bahamas (97.7%, a difference of 0.010%), Immigrants from Northern Africa (97.7%, a difference of 0.020%), and Moroccan (97.7%, a difference of 0.020%).
| Demographics | Rating | Rank | 2nd Grade |
| Immigrants | Albania | 18.4 /100 | #204 | Poor 97.8% |
| Immigrants | Southern Europe | 18.1 /100 | #205 | Poor 97.8% |
| Immigrants | Chile | 17.3 /100 | #206 | Poor 97.7% |
| Africans | 15.6 /100 | #207 | Poor 97.7% |
| Immigrants | Northern Africa | 12.3 /100 | #208 | Poor 97.7% |
| Immigrants | Oceania | 10.9 /100 | #209 | Poor 97.7% |
| Costa Ricans | 10.5 /100 | #210 | Poor 97.7% |
| Laotians | 9.9 /100 | #211 | Tragic 97.7% |
| Immigrants | Bahamas | 8.4 /100 | #212 | Tragic 97.7% |
| Moroccans | 8.2 /100 | #213 | Tragic 97.7% |
| Samoans | 7.1 /100 | #214 | Tragic 97.7% |
| Bahamians | 6.8 /100 | #215 | Tragic 97.7% |
| South American Indians | 6.7 /100 | #216 | Tragic 97.7% |
| Uruguayans | 6.2 /100 | #217 | Tragic 97.7% |
| Sudanese | 5.7 /100 | #218 | Tragic 97.7% |