Moroccan vs Laotian 2nd Grade
COMPARE
Moroccan
Laotian
2nd Grade
2nd Grade Comparison
Moroccans
Laotians
97.7%
2ND GRADE
8.2/ 100
METRIC RATING
213th/ 347
METRIC RANK
97.7%
2ND GRADE
9.9/ 100
METRIC RATING
211th/ 347
METRIC RANK
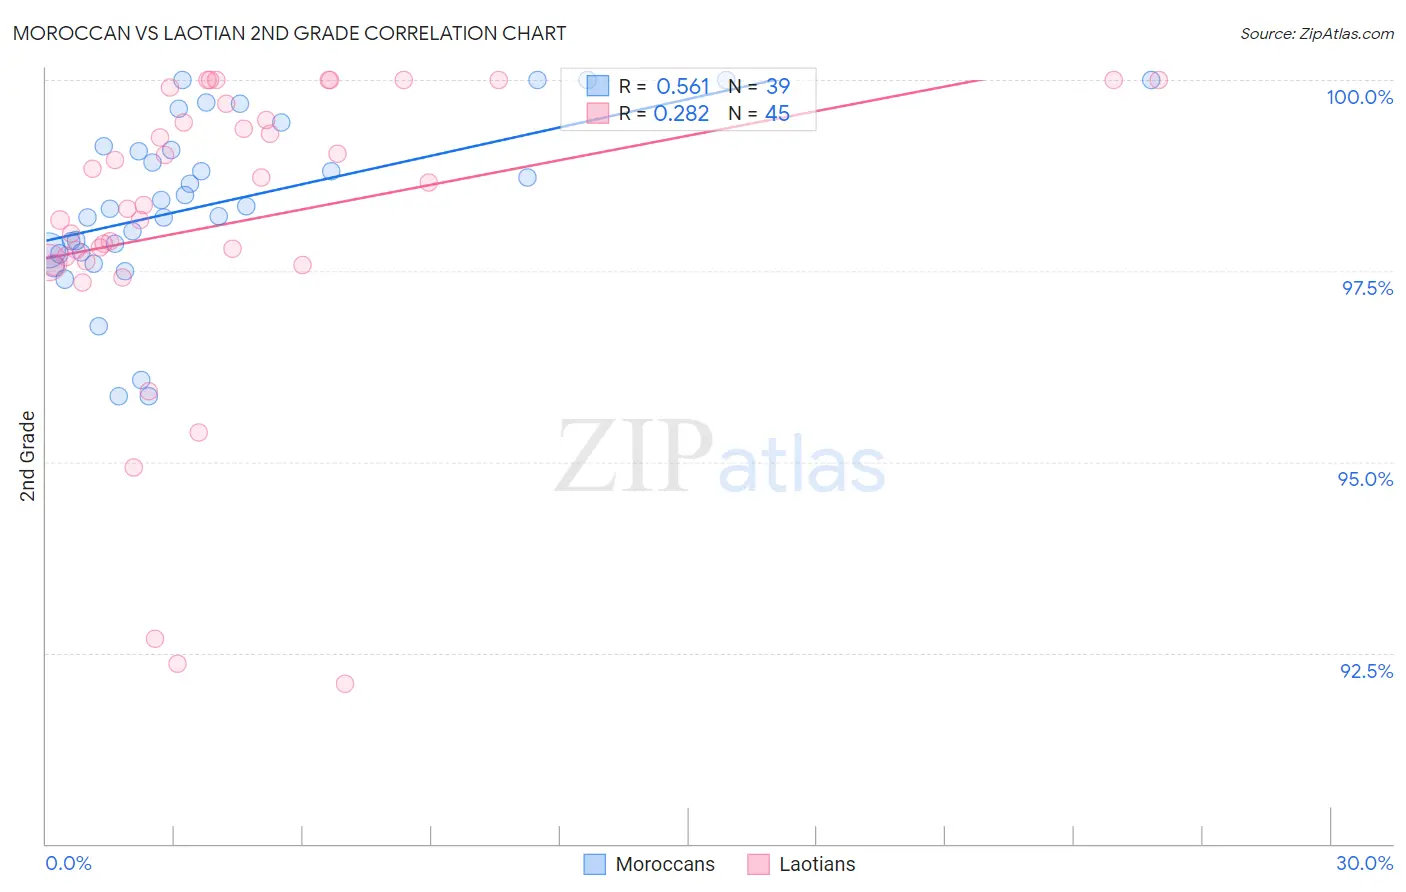
Moroccan vs Laotian 2nd Grade Correlation Chart
The statistical analysis conducted on geographies consisting of 201,817,667 people shows a substantial positive correlation between the proportion of Moroccans and percentage of population with at least 2nd grade education in the United States with a correlation coefficient (R) of 0.561 and weighted average of 97.7%. Similarly, the statistical analysis conducted on geographies consisting of 224,863,064 people shows a weak positive correlation between the proportion of Laotians and percentage of population with at least 2nd grade education in the United States with a correlation coefficient (R) of 0.282 and weighted average of 97.7%, a difference of 0.020%.
2nd Grade Correlation Summary
| Measurement | Moroccan | Laotian |
| Minimum | 95.9% | 92.1% |
| Maximum | 100.0% | 100.0% |
| Range | 4.1% | 7.9% |
| Mean | 98.4% | 98.1% |
| Median | 98.3% | 98.4% |
| Interquartile 25% (IQ1) | 97.7% | 97.6% |
| Interquartile 75% (IQ3) | 99.1% | 99.6% |
| Interquartile Range (IQR) | 1.4% | 2.0% |
| Standard Deviation (Sample) | 1.1% | 2.0% |
| Standard Deviation (Population) | 1.1% | 2.0% |
Demographics Similar to Moroccans and Laotians by 2nd Grade
In terms of 2nd grade, the demographic groups most similar to Moroccans are Immigrants from Bahamas (97.7%, a difference of 0.0%), Samoan (97.7%, a difference of 0.010%), Immigrants from Oceania (97.7%, a difference of 0.020%), Costa Rican (97.7%, a difference of 0.020%), and Bahamian (97.7%, a difference of 0.020%). Similarly, the demographic groups most similar to Laotians are Costa Rican (97.7%, a difference of 0.0%), Immigrants from Oceania (97.7%, a difference of 0.010%), Immigrants from Bahamas (97.7%, a difference of 0.010%), Immigrants from Northern Africa (97.7%, a difference of 0.020%), and Samoan (97.7%, a difference of 0.030%).
| Demographics | Rating | Rank | 2nd Grade |
| Immigrants | Ukraine | 20.5 /100 | #202 | Fair 97.8% |
| Yuman | 20.0 /100 | #203 | Fair 97.8% |
| Immigrants | Albania | 18.4 /100 | #204 | Poor 97.8% |
| Immigrants | Southern Europe | 18.1 /100 | #205 | Poor 97.8% |
| Immigrants | Chile | 17.3 /100 | #206 | Poor 97.7% |
| Africans | 15.6 /100 | #207 | Poor 97.7% |
| Immigrants | Northern Africa | 12.3 /100 | #208 | Poor 97.7% |
| Immigrants | Oceania | 10.9 /100 | #209 | Poor 97.7% |
| Costa Ricans | 10.5 /100 | #210 | Poor 97.7% |
| Laotians | 9.9 /100 | #211 | Tragic 97.7% |
| Immigrants | Bahamas | 8.4 /100 | #212 | Tragic 97.7% |
| Moroccans | 8.2 /100 | #213 | Tragic 97.7% |
| Samoans | 7.1 /100 | #214 | Tragic 97.7% |
| Bahamians | 6.8 /100 | #215 | Tragic 97.7% |
| South American Indians | 6.7 /100 | #216 | Tragic 97.7% |
| Uruguayans | 6.2 /100 | #217 | Tragic 97.7% |
| Sudanese | 5.7 /100 | #218 | Tragic 97.7% |
| Immigrants | Panama | 5.1 /100 | #219 | Tragic 97.6% |
| Immigrants | Morocco | 5.0 /100 | #220 | Tragic 97.6% |
| Iraqis | 4.6 /100 | #221 | Tragic 97.6% |
| Immigrants | Sudan | 4.5 /100 | #222 | Tragic 97.6% |