Immigrants from Argentina vs Immigrants from the Azores 2nd Grade
COMPARE
Immigrants from Argentina
Immigrants from the Azores
2nd Grade
2nd Grade Comparison
Immigrants from Argentina
Immigrants from the Azores
97.8%
2ND GRADE
40.6/ 100
METRIC RATING
185th/ 347
METRIC RANK
96.8%
2ND GRADE
0.0/ 100
METRIC RATING
307th/ 347
METRIC RANK
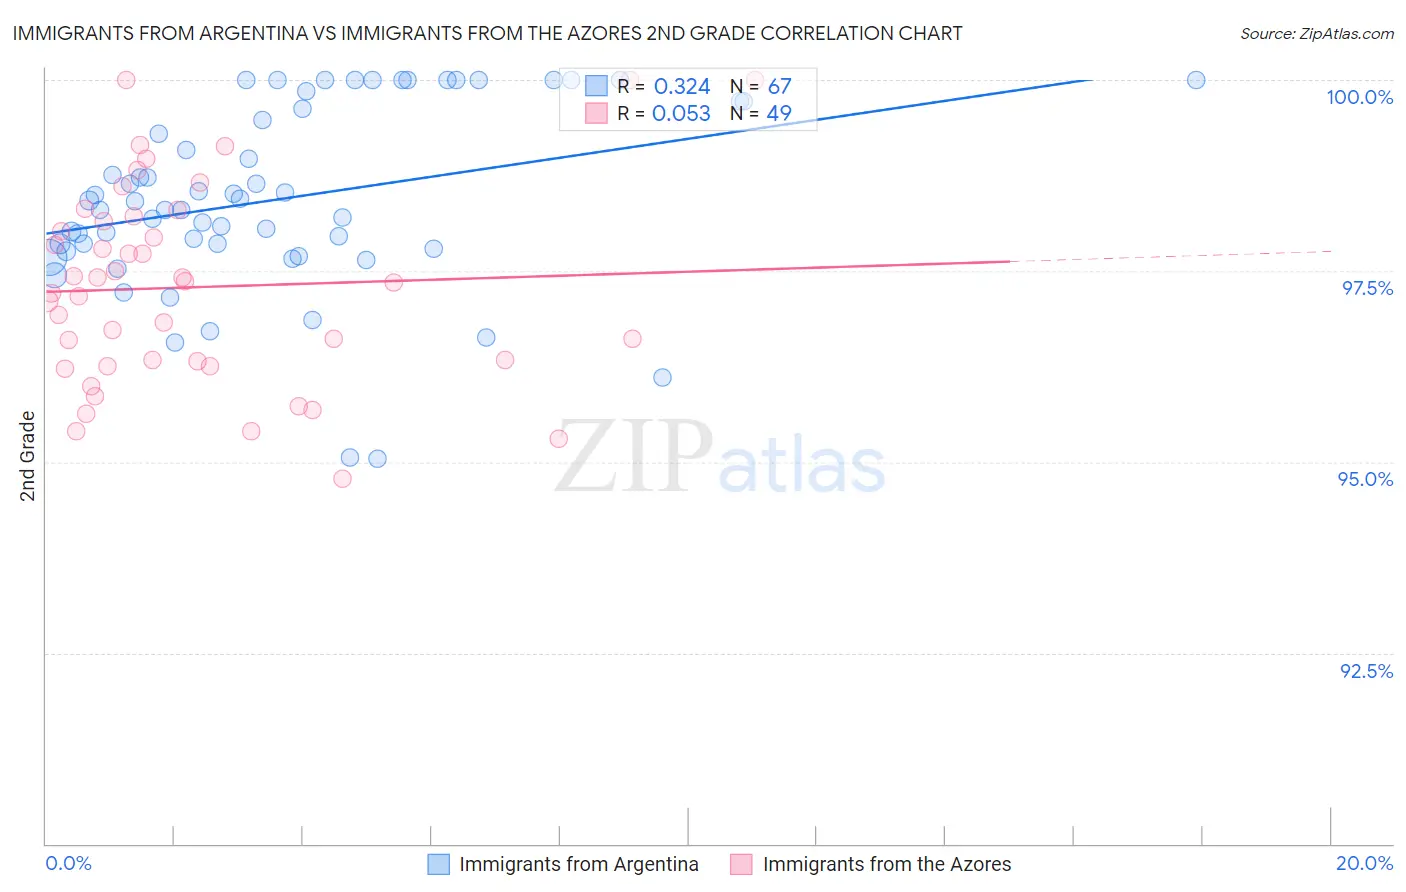
Immigrants from Argentina vs Immigrants from the Azores 2nd Grade Correlation Chart
The statistical analysis conducted on geographies consisting of 264,429,773 people shows a mild positive correlation between the proportion of Immigrants from Argentina and percentage of population with at least 2nd grade education in the United States with a correlation coefficient (R) of 0.324 and weighted average of 97.8%. Similarly, the statistical analysis conducted on geographies consisting of 46,257,310 people shows a slight positive correlation between the proportion of Immigrants from the Azores and percentage of population with at least 2nd grade education in the United States with a correlation coefficient (R) of 0.053 and weighted average of 96.8%, a difference of 1.0%.
2nd Grade Correlation Summary
| Measurement | Immigrants from Argentina | Immigrants from the Azores |
| Minimum | 95.0% | 94.8% |
| Maximum | 100.0% | 100.0% |
| Range | 5.0% | 5.2% |
| Mean | 98.4% | 97.3% |
| Median | 98.4% | 97.3% |
| Interquartile 25% (IQ1) | 97.8% | 96.3% |
| Interquartile 75% (IQ3) | 99.7% | 98.2% |
| Interquartile Range (IQR) | 1.9% | 1.9% |
| Standard Deviation (Sample) | 1.2% | 1.3% |
| Standard Deviation (Population) | 1.2% | 1.3% |
Similar Demographics by 2nd Grade
Demographics Similar to Immigrants from Argentina by 2nd Grade
In terms of 2nd grade, the demographic groups most similar to Immigrants from Argentina are Immigrants from Belarus (97.8%, a difference of 0.0%), Native/Alaskan (97.9%, a difference of 0.010%), Egyptian (97.9%, a difference of 0.010%), Portuguese (97.8%, a difference of 0.010%), and Immigrants from Poland (97.8%, a difference of 0.010%).
| Demographics | Rating | Rank | 2nd Grade |
| Argentineans | 46.3 /100 | #178 | Average 97.9% |
| Immigrants | Venezuela | 46.1 /100 | #179 | Average 97.9% |
| Natives/Alaskans | 44.3 /100 | #180 | Average 97.9% |
| Egyptians | 44.3 /100 | #181 | Average 97.9% |
| Portuguese | 42.4 /100 | #182 | Average 97.8% |
| Immigrants | Poland | 42.2 /100 | #183 | Average 97.8% |
| Immigrants | Belarus | 41.5 /100 | #184 | Average 97.8% |
| Immigrants | Argentina | 40.6 /100 | #185 | Average 97.8% |
| Arabs | 36.9 /100 | #186 | Fair 97.8% |
| Pakistanis | 36.1 /100 | #187 | Fair 97.8% |
| Immigrants | Kazakhstan | 35.6 /100 | #188 | Fair 97.8% |
| Panamanians | 33.5 /100 | #189 | Fair 97.8% |
| Immigrants | Taiwan | 31.8 /100 | #190 | Fair 97.8% |
| Paraguayans | 30.8 /100 | #191 | Fair 97.8% |
| Blacks/African Americans | 29.9 /100 | #192 | Fair 97.8% |
Demographics Similar to Immigrants from the Azores by 2nd Grade
In terms of 2nd grade, the demographic groups most similar to Immigrants from the Azores are Immigrants from Haiti (96.8%, a difference of 0.010%), Belizean (96.8%, a difference of 0.010%), Sri Lankan (96.8%, a difference of 0.020%), Guyanese (96.8%, a difference of 0.020%), and Immigrants from Somalia (96.9%, a difference of 0.030%).
| Demographics | Rating | Rank | 2nd Grade |
| Immigrants | South Eastern Asia | 0.0 /100 | #300 | Tragic 97.0% |
| Central American Indians | 0.0 /100 | #301 | Tragic 97.0% |
| Somalis | 0.0 /100 | #302 | Tragic 97.0% |
| Ecuadorians | 0.0 /100 | #303 | Tragic 96.9% |
| Immigrants | Caribbean | 0.0 /100 | #304 | Tragic 96.9% |
| Nicaraguans | 0.0 /100 | #305 | Tragic 96.9% |
| Immigrants | Somalia | 0.0 /100 | #306 | Tragic 96.9% |
| Immigrants | Azores | 0.0 /100 | #307 | Tragic 96.8% |
| Immigrants | Haiti | 0.0 /100 | #308 | Tragic 96.8% |
| Belizeans | 0.0 /100 | #309 | Tragic 96.8% |
| Sri Lankans | 0.0 /100 | #310 | Tragic 96.8% |
| Guyanese | 0.0 /100 | #311 | Tragic 96.8% |
| Cape Verdeans | 0.0 /100 | #312 | Tragic 96.8% |
| Hispanics or Latinos | 0.0 /100 | #313 | Tragic 96.8% |
| Immigrants | Ecuador | 0.0 /100 | #314 | Tragic 96.8% |