Marshallese vs Laotian 2nd Grade
COMPARE
Marshallese
Laotian
2nd Grade
2nd Grade Comparison
Marshallese
Laotians
97.9%
2ND GRADE
67.7/ 100
METRIC RATING
154th/ 347
METRIC RANK
97.7%
2ND GRADE
9.9/ 100
METRIC RATING
211th/ 347
METRIC RANK
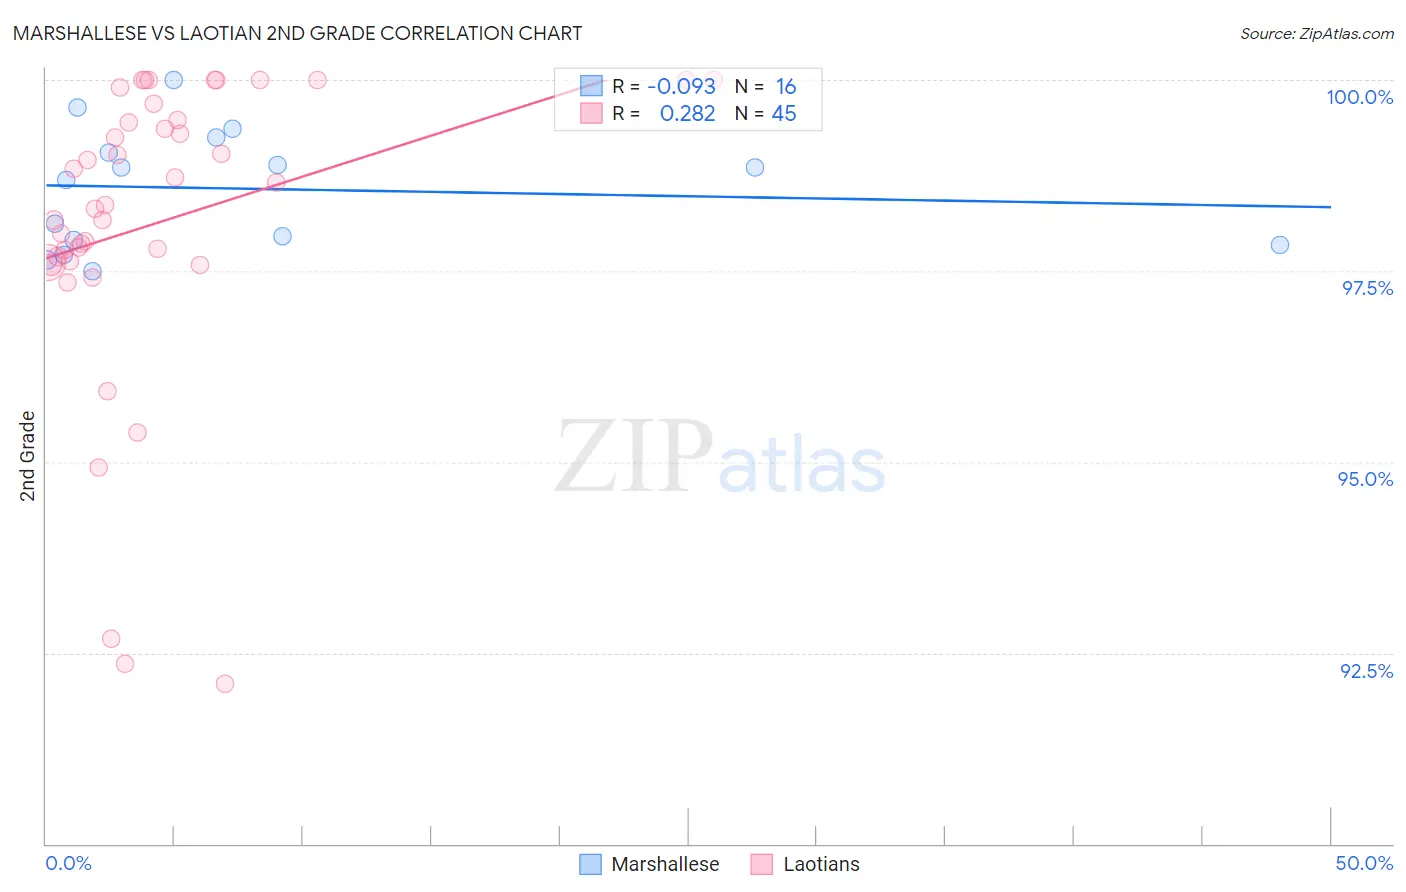
Marshallese vs Laotian 2nd Grade Correlation Chart
The statistical analysis conducted on geographies consisting of 14,761,315 people shows a slight negative correlation between the proportion of Marshallese and percentage of population with at least 2nd grade education in the United States with a correlation coefficient (R) of -0.093 and weighted average of 97.9%. Similarly, the statistical analysis conducted on geographies consisting of 224,863,064 people shows a weak positive correlation between the proportion of Laotians and percentage of population with at least 2nd grade education in the United States with a correlation coefficient (R) of 0.282 and weighted average of 97.7%, a difference of 0.23%.
2nd Grade Correlation Summary
| Measurement | Marshallese | Laotian |
| Minimum | 97.5% | 92.1% |
| Maximum | 100.0% | 100.0% |
| Range | 2.5% | 7.9% |
| Mean | 98.6% | 98.1% |
| Median | 98.8% | 98.4% |
| Interquartile 25% (IQ1) | 97.9% | 97.6% |
| Interquartile 75% (IQ3) | 99.1% | 99.6% |
| Interquartile Range (IQR) | 1.3% | 2.0% |
| Standard Deviation (Sample) | 0.78% | 2.0% |
| Standard Deviation (Population) | 0.75% | 2.0% |
Similar Demographics by 2nd Grade
Demographics Similar to Marshallese by 2nd Grade
In terms of 2nd grade, the demographic groups most similar to Marshallese are Immigrants from North Macedonia (97.9%, a difference of 0.0%), Immigrants from South Central Asia (97.9%, a difference of 0.0%), Soviet Union (97.9%, a difference of 0.010%), French American Indian (97.9%, a difference of 0.010%), and Dutch West Indian (97.9%, a difference of 0.010%).
| Demographics | Rating | Rank | 2nd Grade |
| Immigrants | Greece | 76.8 /100 | #147 | Good 98.0% |
| Jordanians | 74.5 /100 | #148 | Good 98.0% |
| Apache | 74.0 /100 | #149 | Good 97.9% |
| Immigrants | Moldova | 72.9 /100 | #150 | Good 97.9% |
| Soviet Union | 70.7 /100 | #151 | Good 97.9% |
| Immigrants | North Macedonia | 68.5 /100 | #152 | Good 97.9% |
| Immigrants | South Central Asia | 68.3 /100 | #153 | Good 97.9% |
| Marshallese | 67.7 /100 | #154 | Good 97.9% |
| French American Indians | 64.3 /100 | #155 | Good 97.9% |
| Dutch West Indians | 63.8 /100 | #156 | Good 97.9% |
| Venezuelans | 63.3 /100 | #157 | Good 97.9% |
| Immigrants | Iran | 62.8 /100 | #158 | Good 97.9% |
| Comanche | 62.8 /100 | #159 | Good 97.9% |
| Immigrants | Eastern Europe | 61.1 /100 | #160 | Good 97.9% |
| Immigrants | Russia | 60.3 /100 | #161 | Good 97.9% |
Demographics Similar to Laotians by 2nd Grade
In terms of 2nd grade, the demographic groups most similar to Laotians are Costa Rican (97.7%, a difference of 0.0%), Immigrants from Oceania (97.7%, a difference of 0.010%), Immigrants from Bahamas (97.7%, a difference of 0.010%), Immigrants from Northern Africa (97.7%, a difference of 0.020%), and Moroccan (97.7%, a difference of 0.020%).
| Demographics | Rating | Rank | 2nd Grade |
| Immigrants | Albania | 18.4 /100 | #204 | Poor 97.8% |
| Immigrants | Southern Europe | 18.1 /100 | #205 | Poor 97.8% |
| Immigrants | Chile | 17.3 /100 | #206 | Poor 97.7% |
| Africans | 15.6 /100 | #207 | Poor 97.7% |
| Immigrants | Northern Africa | 12.3 /100 | #208 | Poor 97.7% |
| Immigrants | Oceania | 10.9 /100 | #209 | Poor 97.7% |
| Costa Ricans | 10.5 /100 | #210 | Poor 97.7% |
| Laotians | 9.9 /100 | #211 | Tragic 97.7% |
| Immigrants | Bahamas | 8.4 /100 | #212 | Tragic 97.7% |
| Moroccans | 8.2 /100 | #213 | Tragic 97.7% |
| Samoans | 7.1 /100 | #214 | Tragic 97.7% |
| Bahamians | 6.8 /100 | #215 | Tragic 97.7% |
| South American Indians | 6.7 /100 | #216 | Tragic 97.7% |
| Uruguayans | 6.2 /100 | #217 | Tragic 97.7% |
| Sudanese | 5.7 /100 | #218 | Tragic 97.7% |