Immigrants from Argentina vs Spanish American 2nd Grade
COMPARE
Immigrants from Argentina
Spanish American
2nd Grade
2nd Grade Comparison
Immigrants from Argentina
Spanish Americans
97.8%
2ND GRADE
40.6/ 100
METRIC RATING
185th/ 347
METRIC RANK
97.9%
2ND GRADE
56.4/ 100
METRIC RATING
165th/ 347
METRIC RANK
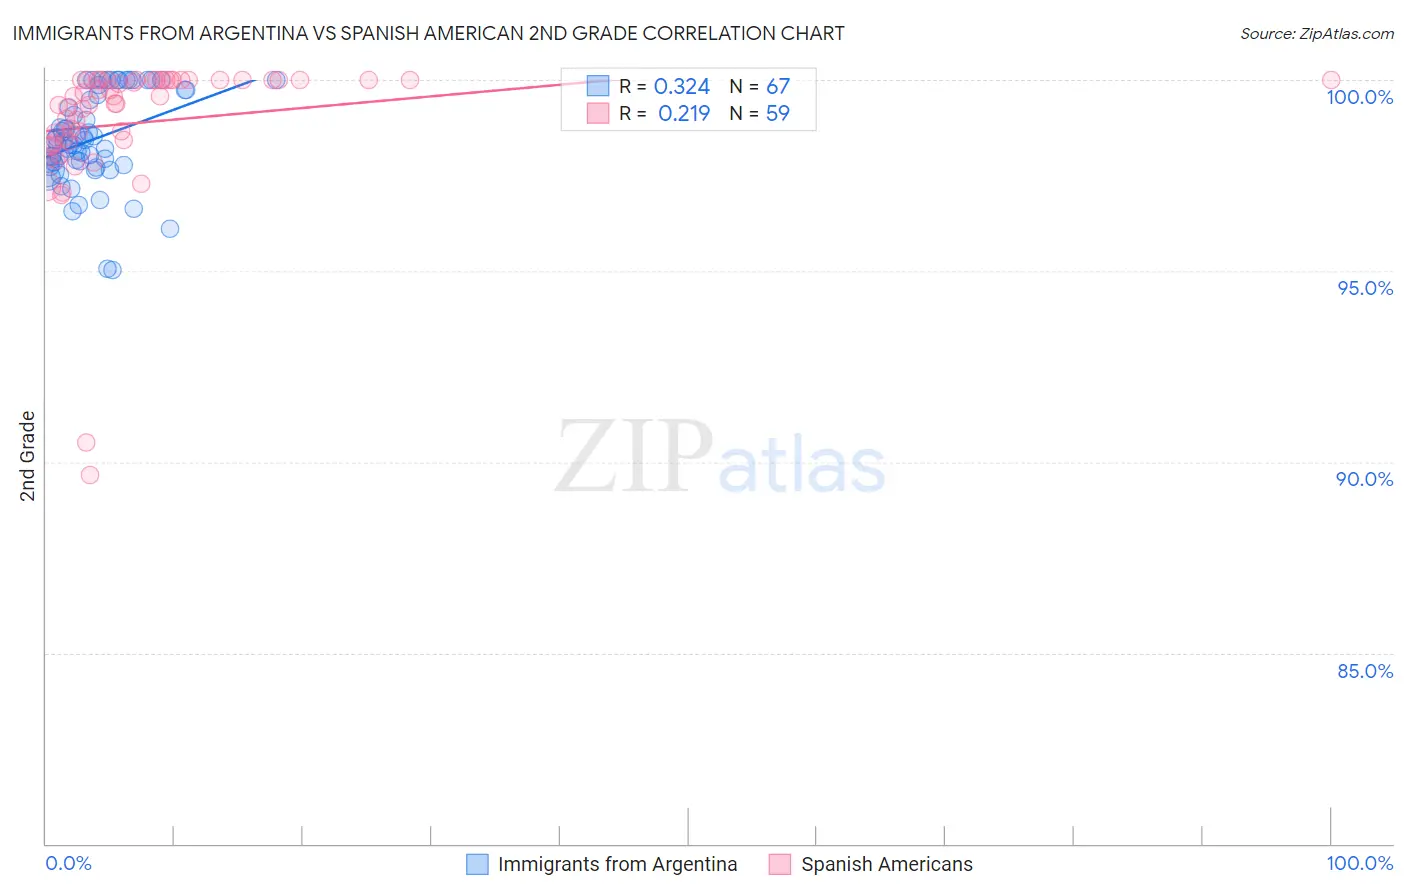
Immigrants from Argentina vs Spanish American 2nd Grade Correlation Chart
The statistical analysis conducted on geographies consisting of 264,429,773 people shows a mild positive correlation between the proportion of Immigrants from Argentina and percentage of population with at least 2nd grade education in the United States with a correlation coefficient (R) of 0.324 and weighted average of 97.8%. Similarly, the statistical analysis conducted on geographies consisting of 103,168,542 people shows a weak positive correlation between the proportion of Spanish Americans and percentage of population with at least 2nd grade education in the United States with a correlation coefficient (R) of 0.219 and weighted average of 97.9%, a difference of 0.050%.
2nd Grade Correlation Summary
| Measurement | Immigrants from Argentina | Spanish American |
| Minimum | 95.0% | 89.6% |
| Maximum | 100.0% | 100.0% |
| Range | 5.0% | 10.4% |
| Mean | 98.4% | 98.9% |
| Median | 98.4% | 99.6% |
| Interquartile 25% (IQ1) | 97.8% | 98.4% |
| Interquartile 75% (IQ3) | 99.7% | 100.0% |
| Interquartile Range (IQR) | 1.9% | 1.6% |
| Standard Deviation (Sample) | 1.2% | 1.9% |
| Standard Deviation (Population) | 1.2% | 1.9% |
Demographics Similar to Immigrants from Argentina and Spanish Americans by 2nd Grade
In terms of 2nd grade, the demographic groups most similar to Immigrants from Argentina are Immigrants from Belarus (97.8%, a difference of 0.0%), Native/Alaskan (97.9%, a difference of 0.010%), Egyptian (97.9%, a difference of 0.010%), Portuguese (97.8%, a difference of 0.010%), and Immigrants from Poland (97.8%, a difference of 0.010%). Similarly, the demographic groups most similar to Spanish Americans are Immigrants from Jordan (97.9%, a difference of 0.0%), Chilean (97.9%, a difference of 0.0%), Brazilian (97.9%, a difference of 0.0%), Immigrants from Spain (97.9%, a difference of 0.0%), and Navajo (97.9%, a difference of 0.010%).
| Demographics | Rating | Rank | 2nd Grade |
| Spanish Americans | 56.4 /100 | #165 | Average 97.9% |
| Immigrants | Jordan | 56.3 /100 | #166 | Average 97.9% |
| Chileans | 56.1 /100 | #167 | Average 97.9% |
| Brazilians | 55.8 /100 | #168 | Average 97.9% |
| Immigrants | Spain | 55.4 /100 | #169 | Average 97.9% |
| Navajo | 54.3 /100 | #170 | Average 97.9% |
| Albanians | 52.8 /100 | #171 | Average 97.9% |
| Immigrants | Korea | 52.7 /100 | #172 | Average 97.9% |
| Kenyans | 52.7 /100 | #173 | Average 97.9% |
| Immigrants | Micronesia | 50.0 /100 | #174 | Average 97.9% |
| Immigrants | Bosnia and Herzegovina | 49.8 /100 | #175 | Average 97.9% |
| Immigrants | Sri Lanka | 48.7 /100 | #176 | Average 97.9% |
| Immigrants | Brazil | 46.6 /100 | #177 | Average 97.9% |
| Argentineans | 46.3 /100 | #178 | Average 97.9% |
| Immigrants | Venezuela | 46.1 /100 | #179 | Average 97.9% |
| Natives/Alaskans | 44.3 /100 | #180 | Average 97.9% |
| Egyptians | 44.3 /100 | #181 | Average 97.9% |
| Portuguese | 42.4 /100 | #182 | Average 97.8% |
| Immigrants | Poland | 42.2 /100 | #183 | Average 97.8% |
| Immigrants | Belarus | 41.5 /100 | #184 | Average 97.8% |
| Immigrants | Argentina | 40.6 /100 | #185 | Average 97.8% |