Menominee vs Laotian 2nd Grade
COMPARE
Menominee
Laotian
2nd Grade
2nd Grade Comparison
Menominee
Laotians
98.1%
2ND GRADE
94.1/ 100
METRIC RATING
124th/ 347
METRIC RANK
97.7%
2ND GRADE
9.9/ 100
METRIC RATING
211th/ 347
METRIC RANK
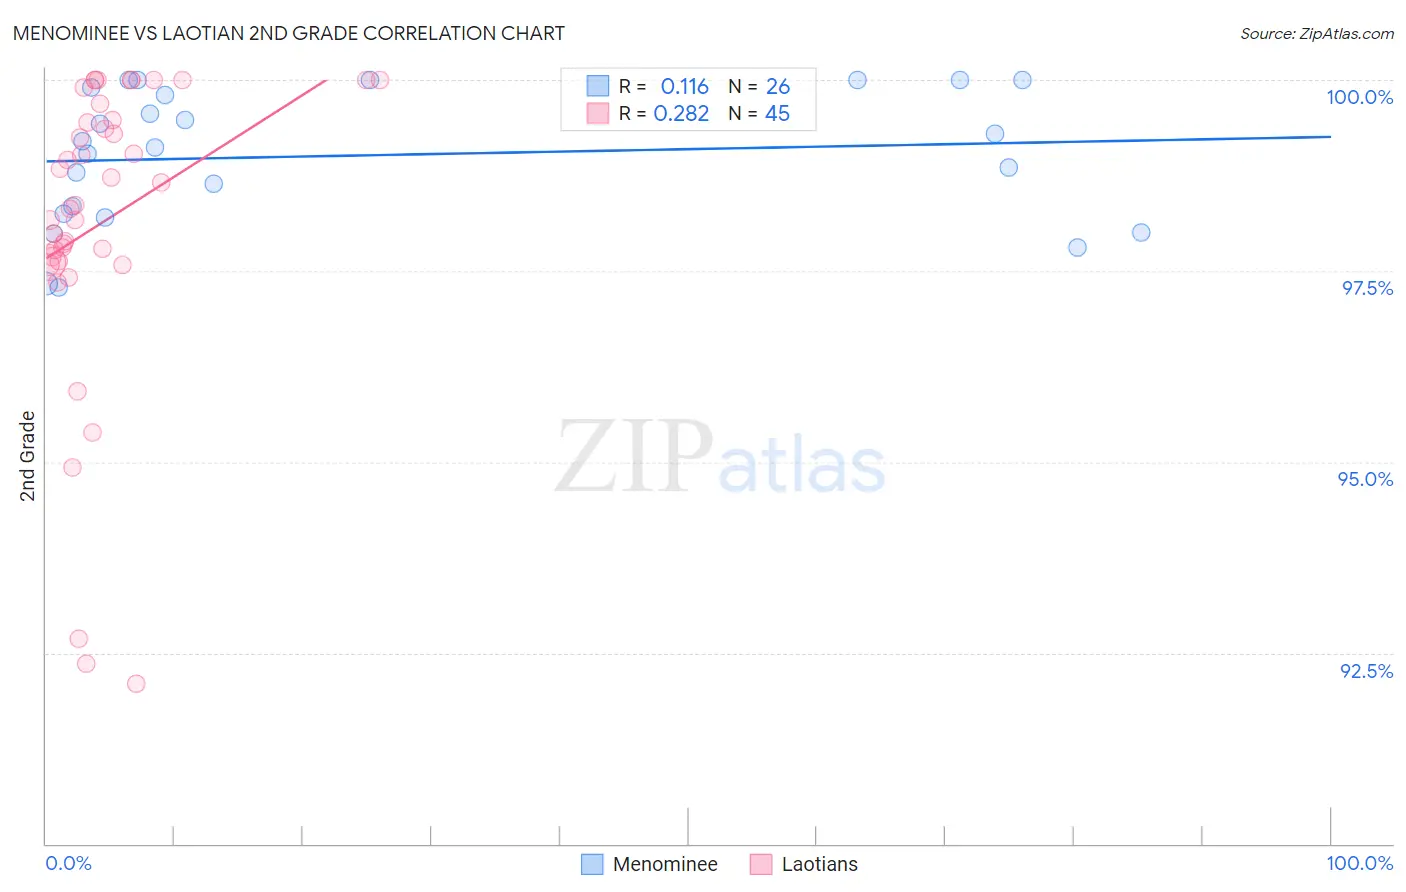
Menominee vs Laotian 2nd Grade Correlation Chart
The statistical analysis conducted on geographies consisting of 45,778,979 people shows a poor positive correlation between the proportion of Menominee and percentage of population with at least 2nd grade education in the United States with a correlation coefficient (R) of 0.116 and weighted average of 98.1%. Similarly, the statistical analysis conducted on geographies consisting of 224,863,064 people shows a weak positive correlation between the proportion of Laotians and percentage of population with at least 2nd grade education in the United States with a correlation coefficient (R) of 0.282 and weighted average of 97.7%, a difference of 0.39%.
2nd Grade Correlation Summary
| Measurement | Menominee | Laotian |
| Minimum | 97.3% | 92.1% |
| Maximum | 100.0% | 100.0% |
| Range | 2.7% | 7.9% |
| Mean | 99.0% | 98.1% |
| Median | 99.2% | 98.4% |
| Interquartile 25% (IQ1) | 98.3% | 97.6% |
| Interquartile 75% (IQ3) | 99.9% | 99.6% |
| Interquartile Range (IQR) | 1.6% | 2.0% |
| Standard Deviation (Sample) | 0.88% | 2.0% |
| Standard Deviation (Population) | 0.86% | 2.0% |
Similar Demographics by 2nd Grade
Demographics Similar to Menominee by 2nd Grade
In terms of 2nd grade, the demographic groups most similar to Menominee are Immigrants from Zimbabwe (98.1%, a difference of 0.0%), Lebanese (98.1%, a difference of 0.0%), Immigrants from Japan (98.1%, a difference of 0.0%), Iroquois (98.1%, a difference of 0.0%), and Syrian (98.1%, a difference of 0.0%).
| Demographics | Rating | Rank | 2nd Grade |
| Ute | 95.7 /100 | #117 | Exceptional 98.1% |
| Immigrants | France | 95.6 /100 | #118 | Exceptional 98.1% |
| Thais | 95.3 /100 | #119 | Exceptional 98.1% |
| Okinawans | 94.9 /100 | #120 | Exceptional 98.1% |
| Immigrants | Zimbabwe | 94.4 /100 | #121 | Exceptional 98.1% |
| Lebanese | 94.2 /100 | #122 | Exceptional 98.1% |
| Immigrants | Japan | 94.1 /100 | #123 | Exceptional 98.1% |
| Menominee | 94.1 /100 | #124 | Exceptional 98.1% |
| Iroquois | 94.1 /100 | #125 | Exceptional 98.1% |
| Syrians | 94.0 /100 | #126 | Exceptional 98.1% |
| Immigrants | Saudi Arabia | 93.6 /100 | #127 | Exceptional 98.1% |
| Immigrants | Serbia | 92.3 /100 | #128 | Exceptional 98.1% |
| Immigrants | Croatia | 92.1 /100 | #129 | Exceptional 98.1% |
| Seminole | 91.1 /100 | #130 | Exceptional 98.0% |
| Immigrants | Europe | 91.1 /100 | #131 | Exceptional 98.0% |
Demographics Similar to Laotians by 2nd Grade
In terms of 2nd grade, the demographic groups most similar to Laotians are Costa Rican (97.7%, a difference of 0.0%), Immigrants from Oceania (97.7%, a difference of 0.010%), Immigrants from Bahamas (97.7%, a difference of 0.010%), Immigrants from Northern Africa (97.7%, a difference of 0.020%), and Moroccan (97.7%, a difference of 0.020%).
| Demographics | Rating | Rank | 2nd Grade |
| Immigrants | Albania | 18.4 /100 | #204 | Poor 97.8% |
| Immigrants | Southern Europe | 18.1 /100 | #205 | Poor 97.8% |
| Immigrants | Chile | 17.3 /100 | #206 | Poor 97.7% |
| Africans | 15.6 /100 | #207 | Poor 97.7% |
| Immigrants | Northern Africa | 12.3 /100 | #208 | Poor 97.7% |
| Immigrants | Oceania | 10.9 /100 | #209 | Poor 97.7% |
| Costa Ricans | 10.5 /100 | #210 | Poor 97.7% |
| Laotians | 9.9 /100 | #211 | Tragic 97.7% |
| Immigrants | Bahamas | 8.4 /100 | #212 | Tragic 97.7% |
| Moroccans | 8.2 /100 | #213 | Tragic 97.7% |
| Samoans | 7.1 /100 | #214 | Tragic 97.7% |
| Bahamians | 6.8 /100 | #215 | Tragic 97.7% |
| South American Indians | 6.7 /100 | #216 | Tragic 97.7% |
| Uruguayans | 6.2 /100 | #217 | Tragic 97.7% |
| Sudanese | 5.7 /100 | #218 | Tragic 97.7% |