Ugandan vs Immigrants from the Azores 2nd Grade
COMPARE
Ugandan
Immigrants from the Azores
2nd Grade
2nd Grade Comparison
Ugandans
Immigrants from the Azores
97.9%
2ND GRADE
56.6/ 100
METRIC RATING
164th/ 347
METRIC RANK
96.8%
2ND GRADE
0.0/ 100
METRIC RATING
307th/ 347
METRIC RANK
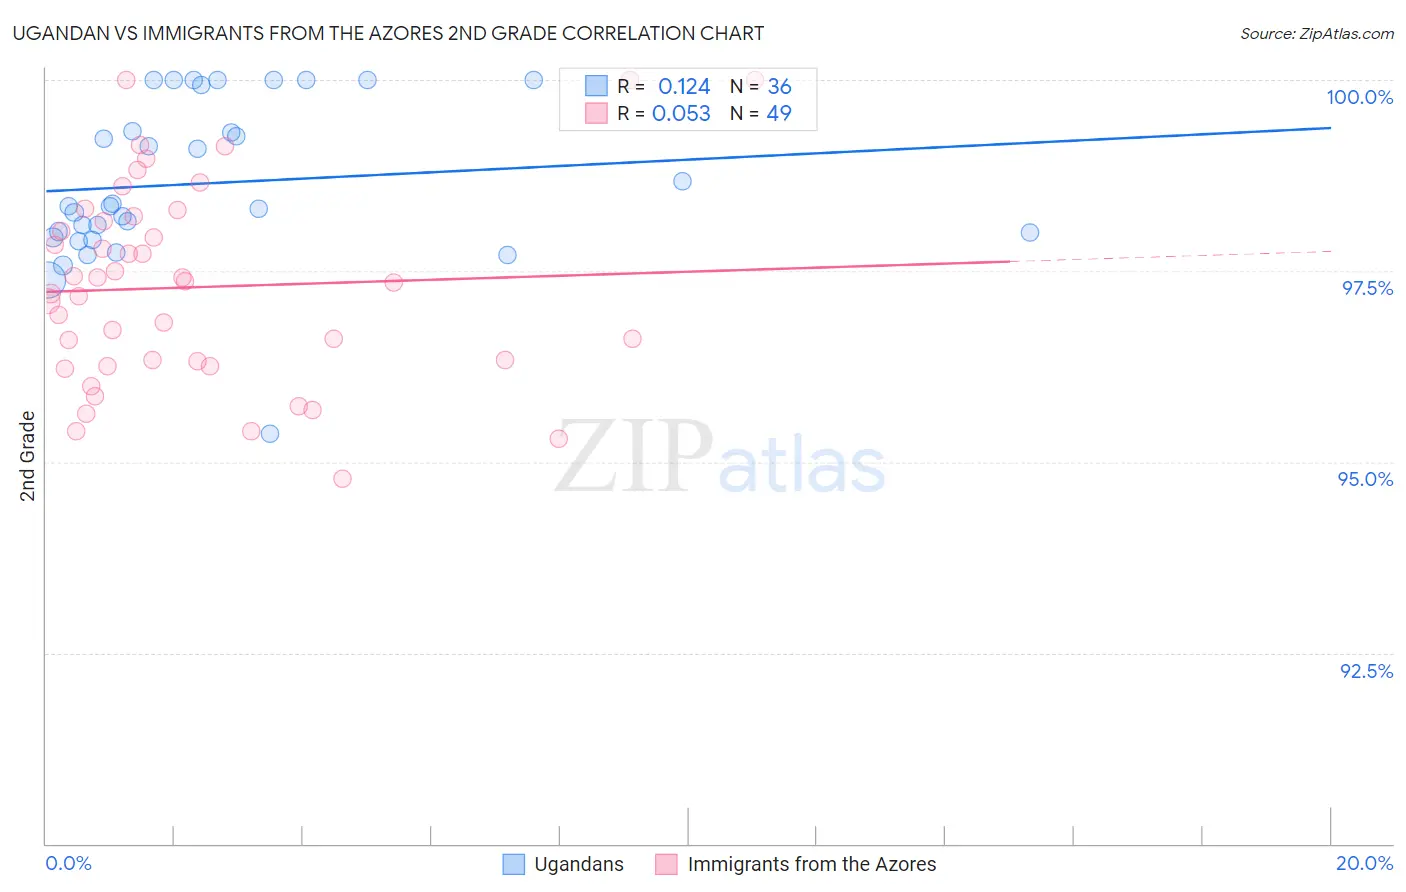
Ugandan vs Immigrants from the Azores 2nd Grade Correlation Chart
The statistical analysis conducted on geographies consisting of 93,991,892 people shows a poor positive correlation between the proportion of Ugandans and percentage of population with at least 2nd grade education in the United States with a correlation coefficient (R) of 0.124 and weighted average of 97.9%. Similarly, the statistical analysis conducted on geographies consisting of 46,257,310 people shows a slight positive correlation between the proportion of Immigrants from the Azores and percentage of population with at least 2nd grade education in the United States with a correlation coefficient (R) of 0.053 and weighted average of 96.8%, a difference of 1.1%.
2nd Grade Correlation Summary
| Measurement | Ugandan | Immigrants from the Azores |
| Minimum | 95.4% | 94.8% |
| Maximum | 100.0% | 100.0% |
| Range | 4.6% | 5.2% |
| Mean | 98.7% | 97.3% |
| Median | 98.3% | 97.3% |
| Interquartile 25% (IQ1) | 98.0% | 96.3% |
| Interquartile 75% (IQ3) | 99.6% | 98.2% |
| Interquartile Range (IQR) | 1.7% | 1.9% |
| Standard Deviation (Sample) | 1.0% | 1.3% |
| Standard Deviation (Population) | 1.0% | 1.3% |
Similar Demographics by 2nd Grade
Demographics Similar to Ugandans by 2nd Grade
In terms of 2nd grade, the demographic groups most similar to Ugandans are Spanish American (97.9%, a difference of 0.0%), Immigrants from Jordan (97.9%, a difference of 0.0%), Chilean (97.9%, a difference of 0.0%), Brazilian (97.9%, a difference of 0.0%), and Immigrants from Spain (97.9%, a difference of 0.0%).
| Demographics | Rating | Rank | 2nd Grade |
| Venezuelans | 63.3 /100 | #157 | Good 97.9% |
| Immigrants | Iran | 62.8 /100 | #158 | Good 97.9% |
| Comanche | 62.8 /100 | #159 | Good 97.9% |
| Immigrants | Eastern Europe | 61.1 /100 | #160 | Good 97.9% |
| Immigrants | Russia | 60.3 /100 | #161 | Good 97.9% |
| Immigrants | Italy | 60.2 /100 | #162 | Good 97.9% |
| Bermudans | 59.4 /100 | #163 | Average 97.9% |
| Ugandans | 56.6 /100 | #164 | Average 97.9% |
| Spanish Americans | 56.4 /100 | #165 | Average 97.9% |
| Immigrants | Jordan | 56.3 /100 | #166 | Average 97.9% |
| Chileans | 56.1 /100 | #167 | Average 97.9% |
| Brazilians | 55.8 /100 | #168 | Average 97.9% |
| Immigrants | Spain | 55.4 /100 | #169 | Average 97.9% |
| Navajo | 54.3 /100 | #170 | Average 97.9% |
| Albanians | 52.8 /100 | #171 | Average 97.9% |
Demographics Similar to Immigrants from the Azores by 2nd Grade
In terms of 2nd grade, the demographic groups most similar to Immigrants from the Azores are Immigrants from Haiti (96.8%, a difference of 0.010%), Belizean (96.8%, a difference of 0.010%), Sri Lankan (96.8%, a difference of 0.020%), Guyanese (96.8%, a difference of 0.020%), and Immigrants from Somalia (96.9%, a difference of 0.030%).
| Demographics | Rating | Rank | 2nd Grade |
| Immigrants | South Eastern Asia | 0.0 /100 | #300 | Tragic 97.0% |
| Central American Indians | 0.0 /100 | #301 | Tragic 97.0% |
| Somalis | 0.0 /100 | #302 | Tragic 97.0% |
| Ecuadorians | 0.0 /100 | #303 | Tragic 96.9% |
| Immigrants | Caribbean | 0.0 /100 | #304 | Tragic 96.9% |
| Nicaraguans | 0.0 /100 | #305 | Tragic 96.9% |
| Immigrants | Somalia | 0.0 /100 | #306 | Tragic 96.9% |
| Immigrants | Azores | 0.0 /100 | #307 | Tragic 96.8% |
| Immigrants | Haiti | 0.0 /100 | #308 | Tragic 96.8% |
| Belizeans | 0.0 /100 | #309 | Tragic 96.8% |
| Sri Lankans | 0.0 /100 | #310 | Tragic 96.8% |
| Guyanese | 0.0 /100 | #311 | Tragic 96.8% |
| Cape Verdeans | 0.0 /100 | #312 | Tragic 96.8% |
| Hispanics or Latinos | 0.0 /100 | #313 | Tragic 96.8% |
| Immigrants | Ecuador | 0.0 /100 | #314 | Tragic 96.8% |