Immigrants from Argentina vs African In Labor Force | Age 20-24
COMPARE
Immigrants from Argentina
African
In Labor Force | Age 20-24
In Labor Force | Age 20-24 Comparison
Immigrants from Argentina
Africans
72.8%
IN LABOR FORCE | AGE 20-24
0.0/ 100
METRIC RATING
294th/ 347
METRIC RANK
75.0%
IN LABOR FORCE | AGE 20-24
42.5/ 100
METRIC RATING
181st/ 347
METRIC RANK
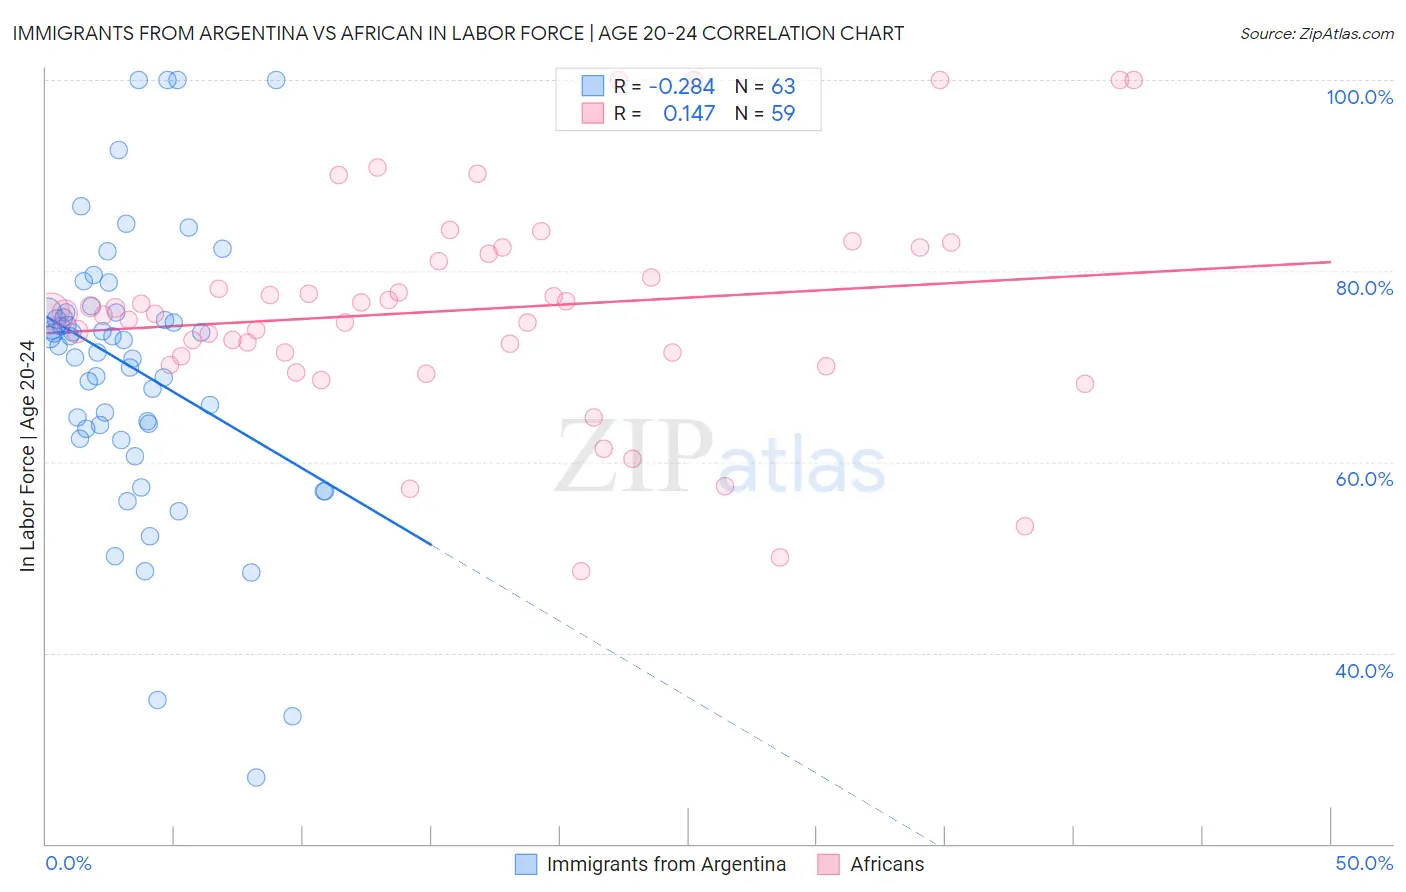
Immigrants from Argentina vs African In Labor Force | Age 20-24 Correlation Chart
The statistical analysis conducted on geographies consisting of 264,369,476 people shows a weak negative correlation between the proportion of Immigrants from Argentina and labor force participation rate among population between the ages 20 and 24 in the United States with a correlation coefficient (R) of -0.284 and weighted average of 72.8%. Similarly, the statistical analysis conducted on geographies consisting of 469,871,149 people shows a poor positive correlation between the proportion of Africans and labor force participation rate among population between the ages 20 and 24 in the United States with a correlation coefficient (R) of 0.147 and weighted average of 75.0%, a difference of 3.0%.
In Labor Force | Age 20-24 Correlation Summary
| Measurement | Immigrants from Argentina | African |
| Minimum | 26.9% | 48.6% |
| Maximum | 100.0% | 100.0% |
| Range | 73.1% | 51.4% |
| Mean | 69.9% | 75.9% |
| Median | 72.8% | 75.6% |
| Interquartile 25% (IQ1) | 63.5% | 71.0% |
| Interquartile 75% (IQ3) | 75.7% | 81.7% |
| Interquartile Range (IQR) | 12.2% | 10.7% |
| Standard Deviation (Sample) | 14.6% | 11.4% |
| Standard Deviation (Population) | 14.5% | 11.3% |
Similar Demographics by In Labor Force | Age 20-24
Demographics Similar to Immigrants from Argentina by In Labor Force | Age 20-24
In terms of in labor force | age 20-24, the demographic groups most similar to Immigrants from Argentina are Immigrants from Belize (72.8%, a difference of 0.030%), Pueblo (72.9%, a difference of 0.090%), Okinawan (72.7%, a difference of 0.11%), Jamaican (72.7%, a difference of 0.11%), and Central American Indian (72.7%, a difference of 0.16%).
| Demographics | Rating | Rank | In Labor Force | Age 20-24 |
| Immigrants | Korea | 0.1 /100 | #287 | Tragic 73.1% |
| Argentineans | 0.1 /100 | #288 | Tragic 73.1% |
| U.S. Virgin Islanders | 0.1 /100 | #289 | Tragic 73.0% |
| Immigrants | Belarus | 0.1 /100 | #290 | Tragic 73.0% |
| Immigrants | Nicaragua | 0.0 /100 | #291 | Tragic 72.9% |
| Pueblo | 0.0 /100 | #292 | Tragic 72.9% |
| Immigrants | Belize | 0.0 /100 | #293 | Tragic 72.8% |
| Immigrants | Argentina | 0.0 /100 | #294 | Tragic 72.8% |
| Okinawans | 0.0 /100 | #295 | Tragic 72.7% |
| Jamaicans | 0.0 /100 | #296 | Tragic 72.7% |
| Central American Indians | 0.0 /100 | #297 | Tragic 72.7% |
| Israelis | 0.0 /100 | #298 | Tragic 72.6% |
| Iranians | 0.0 /100 | #299 | Tragic 72.6% |
| Armenians | 0.0 /100 | #300 | Tragic 72.5% |
| Cubans | 0.0 /100 | #301 | Tragic 72.5% |
Demographics Similar to Africans by In Labor Force | Age 20-24
In terms of in labor force | age 20-24, the demographic groups most similar to Africans are Immigrants from Latvia (75.0%, a difference of 0.020%), Immigrants from Czechoslovakia (75.0%, a difference of 0.020%), Immigrants from Central America (75.0%, a difference of 0.040%), Immigrants from Mexico (75.0%, a difference of 0.080%), and Immigrants from South Africa (74.9%, a difference of 0.080%).
| Demographics | Rating | Rank | In Labor Force | Age 20-24 |
| South Africans | 50.0 /100 | #174 | Average 75.0% |
| Syrians | 49.5 /100 | #175 | Average 75.0% |
| Central Americans | 48.7 /100 | #176 | Average 75.0% |
| Immigrants | Mexico | 47.8 /100 | #177 | Average 75.0% |
| Immigrants | Central America | 45.0 /100 | #178 | Average 75.0% |
| Immigrants | Latvia | 44.1 /100 | #179 | Average 75.0% |
| Immigrants | Czechoslovakia | 44.0 /100 | #180 | Average 75.0% |
| Africans | 42.5 /100 | #181 | Average 75.0% |
| Immigrants | South Africa | 36.9 /100 | #182 | Fair 74.9% |
| Immigrants | Costa Rica | 36.7 /100 | #183 | Fair 74.9% |
| Immigrants | Hungary | 35.0 /100 | #184 | Fair 74.9% |
| Sri Lankans | 34.9 /100 | #185 | Fair 74.9% |
| Immigrants | Eastern Europe | 33.8 /100 | #186 | Fair 74.9% |
| Immigrants | Honduras | 33.5 /100 | #187 | Fair 74.9% |
| Hondurans | 32.7 /100 | #188 | Fair 74.8% |