Immigrants from Albania vs Arapaho College, 1 year or more
COMPARE
Immigrants from Albania
Arapaho
College, 1 year or more
College, 1 year or more Comparison
Immigrants from Albania
Arapaho
59.5%
COLLEGE, 1 YEAR OR MORE
52.3/ 100
METRIC RATING
171st/ 347
METRIC RANK
54.1%
COLLEGE, 1 YEAR OR MORE
0.1/ 100
METRIC RATING
279th/ 347
METRIC RANK
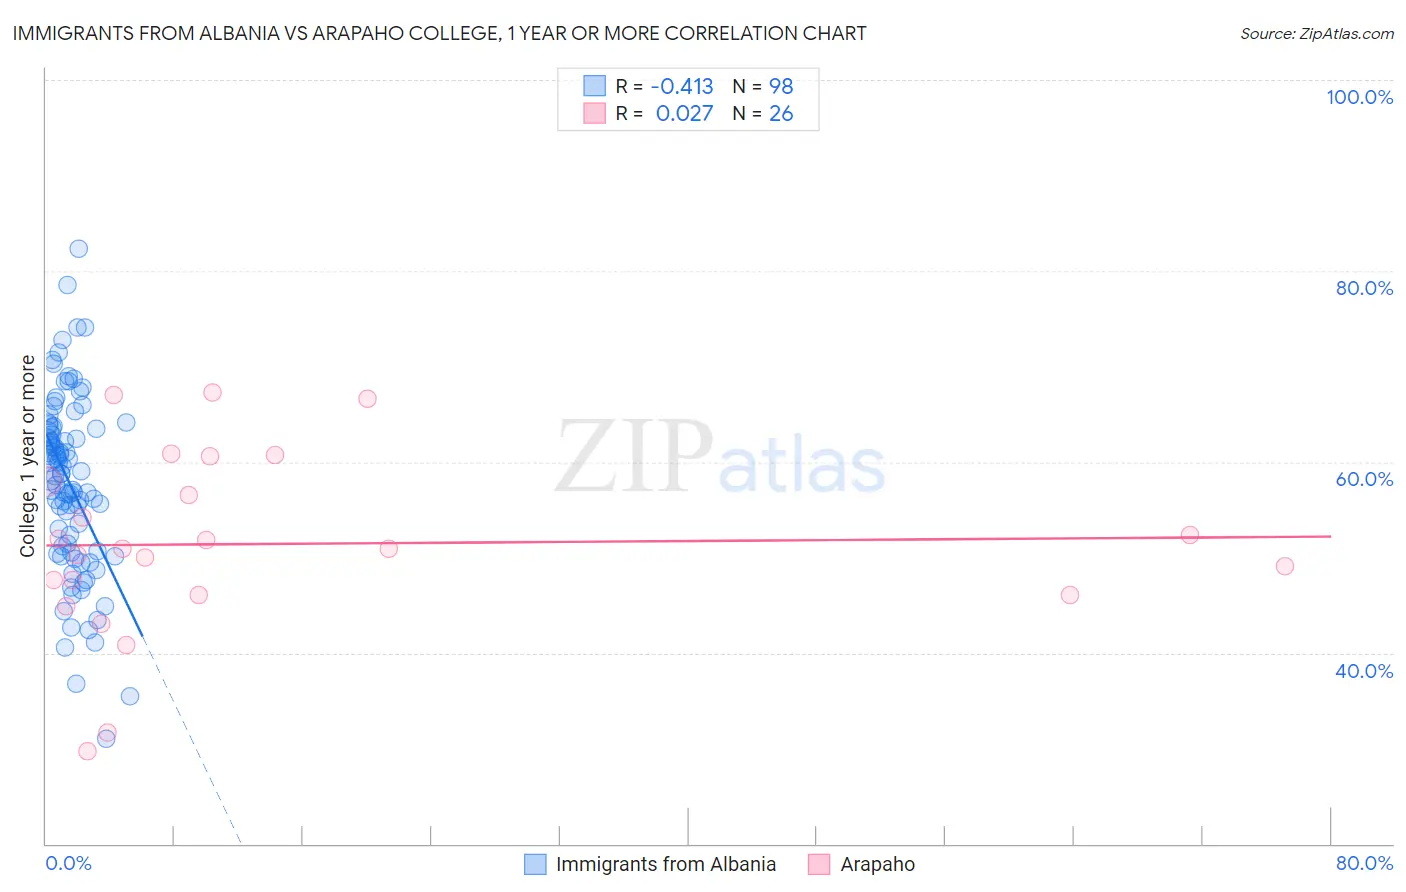
Immigrants from Albania vs Arapaho College, 1 year or more Correlation Chart
The statistical analysis conducted on geographies consisting of 119,397,636 people shows a moderate negative correlation between the proportion of Immigrants from Albania and percentage of population with at least college, 1 year or more education in the United States with a correlation coefficient (R) of -0.413 and weighted average of 59.5%. Similarly, the statistical analysis conducted on geographies consisting of 29,780,040 people shows no correlation between the proportion of Arapaho and percentage of population with at least college, 1 year or more education in the United States with a correlation coefficient (R) of 0.027 and weighted average of 54.1%, a difference of 9.9%.
College, 1 year or more Correlation Summary
| Measurement | Immigrants from Albania | Arapaho |
| Minimum | 31.0% | 29.7% |
| Maximum | 82.3% | 67.3% |
| Range | 51.3% | 37.6% |
| Mean | 57.7% | 51.4% |
| Median | 58.6% | 50.9% |
| Interquartile 25% (IQ1) | 50.6% | 46.1% |
| Interquartile 75% (IQ3) | 63.6% | 58.0% |
| Interquartile Range (IQR) | 12.9% | 11.9% |
| Standard Deviation (Sample) | 9.4% | 9.5% |
| Standard Deviation (Population) | 9.3% | 9.3% |
Similar Demographics by College, 1 year or more
Demographics Similar to Immigrants from Albania by College, 1 year or more
In terms of college, 1 year or more, the demographic groups most similar to Immigrants from Albania are Welsh (59.5%, a difference of 0.0%), Immigrants from Sierra Leone (59.5%, a difference of 0.010%), Immigrants from Southern Europe (59.5%, a difference of 0.020%), Hungarian (59.5%, a difference of 0.030%), and Immigrants from North Macedonia (59.5%, a difference of 0.040%).
| Demographics | Rating | Rank | College, 1 year or more |
| Belgians | 58.1 /100 | #164 | Average 59.7% |
| Irish | 56.1 /100 | #165 | Average 59.6% |
| Immigrants | Africa | 56.1 /100 | #166 | Average 59.6% |
| Immigrants | North Macedonia | 53.1 /100 | #167 | Average 59.5% |
| Hungarians | 52.9 /100 | #168 | Average 59.5% |
| Immigrants | Southern Europe | 52.7 /100 | #169 | Average 59.5% |
| Welsh | 52.4 /100 | #170 | Average 59.5% |
| Immigrants | Albania | 52.3 /100 | #171 | Average 59.5% |
| Immigrants | Sierra Leone | 52.2 /100 | #172 | Average 59.5% |
| Immigrants | Oceania | 51.2 /100 | #173 | Average 59.4% |
| Celtics | 50.0 /100 | #174 | Average 59.4% |
| Sri Lankans | 49.0 /100 | #175 | Average 59.4% |
| Immigrants | Poland | 48.9 /100 | #176 | Average 59.4% |
| Tlingit-Haida | 48.4 /100 | #177 | Average 59.4% |
| Czechoslovakians | 48.3 /100 | #178 | Average 59.4% |
Demographics Similar to Arapaho by College, 1 year or more
In terms of college, 1 year or more, the demographic groups most similar to Arapaho are Immigrants from Jamaica (54.2%, a difference of 0.020%), Cheyenne (54.1%, a difference of 0.060%), Colville (54.1%, a difference of 0.070%), Guyanese (54.1%, a difference of 0.11%), and Ecuadorian (54.3%, a difference of 0.34%).
| Demographics | Rating | Rank | College, 1 year or more |
| Comanche | 0.2 /100 | #272 | Tragic 54.4% |
| Immigrants | Grenada | 0.2 /100 | #273 | Tragic 54.4% |
| Belizeans | 0.2 /100 | #274 | Tragic 54.4% |
| Americans | 0.2 /100 | #275 | Tragic 54.4% |
| Shoshone | 0.2 /100 | #276 | Tragic 54.3% |
| Ecuadorians | 0.2 /100 | #277 | Tragic 54.3% |
| Immigrants | Jamaica | 0.1 /100 | #278 | Tragic 54.2% |
| Arapaho | 0.1 /100 | #279 | Tragic 54.1% |
| Cheyenne | 0.1 /100 | #280 | Tragic 54.1% |
| Colville | 0.1 /100 | #281 | Tragic 54.1% |
| Guyanese | 0.1 /100 | #282 | Tragic 54.1% |
| Nicaraguans | 0.1 /100 | #283 | Tragic 53.9% |
| Ute | 0.1 /100 | #284 | Tragic 53.8% |
| Immigrants | Guyana | 0.1 /100 | #285 | Tragic 53.5% |
| Central American Indians | 0.1 /100 | #286 | Tragic 53.5% |