Immigrants from Albania vs Cherokee College, 1 year or more
COMPARE
Immigrants from Albania
Cherokee
College, 1 year or more
College, 1 year or more Comparison
Immigrants from Albania
Cherokee
59.5%
COLLEGE, 1 YEAR OR MORE
52.3/ 100
METRIC RATING
171st/ 347
METRIC RANK
53.2%
COLLEGE, 1 YEAR OR MORE
0.0/ 100
METRIC RATING
294th/ 347
METRIC RANK
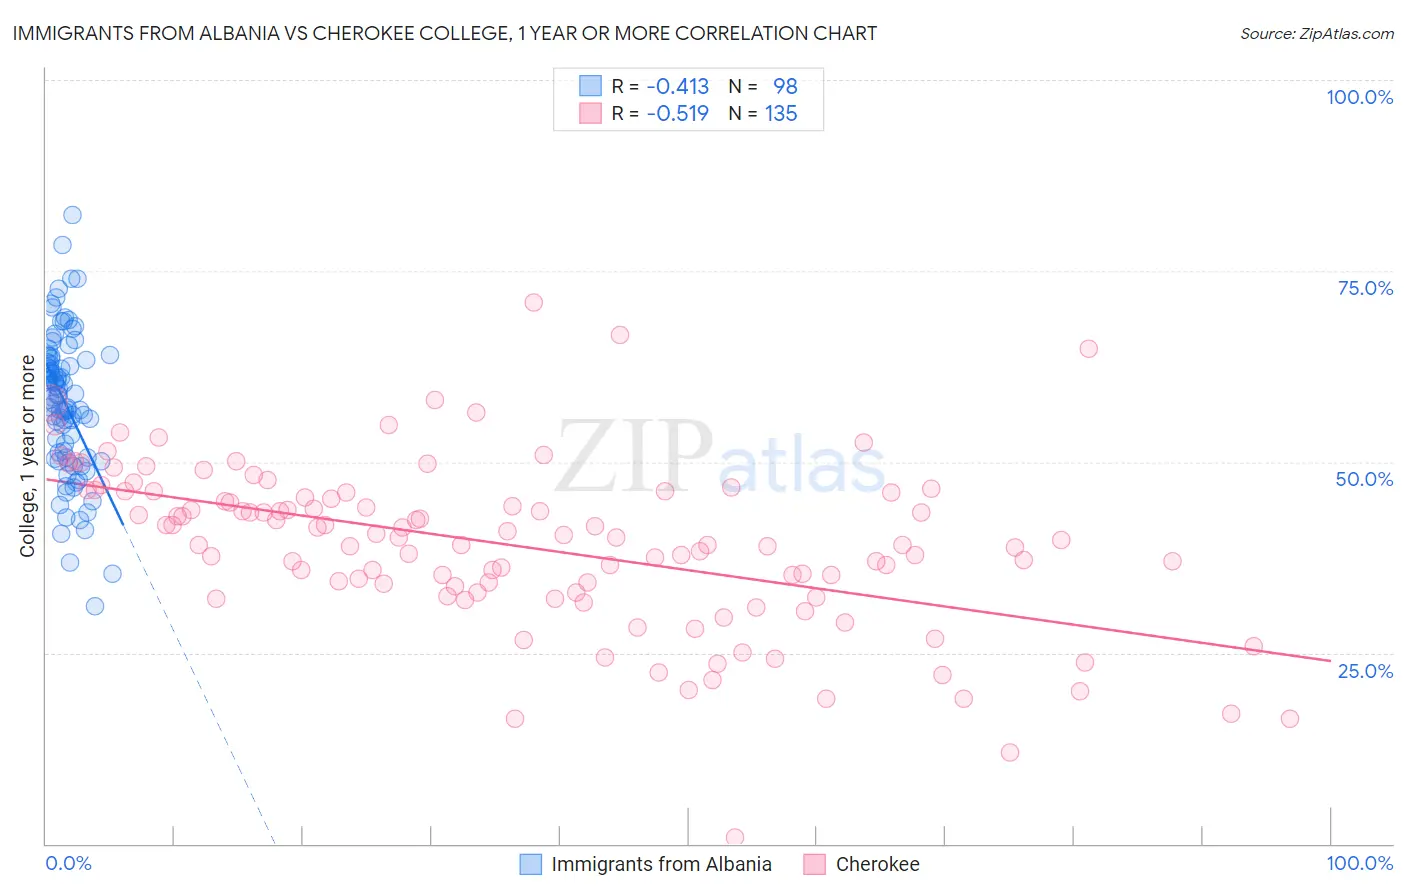
Immigrants from Albania vs Cherokee College, 1 year or more Correlation Chart
The statistical analysis conducted on geographies consisting of 119,397,636 people shows a moderate negative correlation between the proportion of Immigrants from Albania and percentage of population with at least college, 1 year or more education in the United States with a correlation coefficient (R) of -0.413 and weighted average of 59.5%. Similarly, the statistical analysis conducted on geographies consisting of 493,716,621 people shows a substantial negative correlation between the proportion of Cherokee and percentage of population with at least college, 1 year or more education in the United States with a correlation coefficient (R) of -0.519 and weighted average of 53.2%, a difference of 11.8%.
College, 1 year or more Correlation Summary
| Measurement | Immigrants from Albania | Cherokee |
| Minimum | 31.0% | 0.80% |
| Maximum | 82.3% | 70.9% |
| Range | 51.3% | 70.1% |
| Mean | 57.7% | 39.0% |
| Median | 58.6% | 39.7% |
| Interquartile 25% (IQ1) | 50.6% | 33.0% |
| Interquartile 75% (IQ3) | 63.6% | 46.0% |
| Interquartile Range (IQR) | 12.9% | 13.1% |
| Standard Deviation (Sample) | 9.4% | 10.9% |
| Standard Deviation (Population) | 9.3% | 10.9% |
Similar Demographics by College, 1 year or more
Demographics Similar to Immigrants from Albania by College, 1 year or more
In terms of college, 1 year or more, the demographic groups most similar to Immigrants from Albania are Welsh (59.5%, a difference of 0.0%), Immigrants from Sierra Leone (59.5%, a difference of 0.010%), Immigrants from Southern Europe (59.5%, a difference of 0.020%), Hungarian (59.5%, a difference of 0.030%), and Immigrants from North Macedonia (59.5%, a difference of 0.040%).
| Demographics | Rating | Rank | College, 1 year or more |
| Belgians | 58.1 /100 | #164 | Average 59.7% |
| Irish | 56.1 /100 | #165 | Average 59.6% |
| Immigrants | Africa | 56.1 /100 | #166 | Average 59.6% |
| Immigrants | North Macedonia | 53.1 /100 | #167 | Average 59.5% |
| Hungarians | 52.9 /100 | #168 | Average 59.5% |
| Immigrants | Southern Europe | 52.7 /100 | #169 | Average 59.5% |
| Welsh | 52.4 /100 | #170 | Average 59.5% |
| Immigrants | Albania | 52.3 /100 | #171 | Average 59.5% |
| Immigrants | Sierra Leone | 52.2 /100 | #172 | Average 59.5% |
| Immigrants | Oceania | 51.2 /100 | #173 | Average 59.4% |
| Celtics | 50.0 /100 | #174 | Average 59.4% |
| Sri Lankans | 49.0 /100 | #175 | Average 59.4% |
| Immigrants | Poland | 48.9 /100 | #176 | Average 59.4% |
| Tlingit-Haida | 48.4 /100 | #177 | Average 59.4% |
| Czechoslovakians | 48.3 /100 | #178 | Average 59.4% |
Demographics Similar to Cherokee by College, 1 year or more
In terms of college, 1 year or more, the demographic groups most similar to Cherokee are Yaqui (53.2%, a difference of 0.010%), Black/African American (53.3%, a difference of 0.21%), Chickasaw (53.3%, a difference of 0.23%), Sioux (53.0%, a difference of 0.35%), and Cuban (53.4%, a difference of 0.36%).
| Demographics | Rating | Rank | College, 1 year or more |
| Immigrants | Belize | 0.1 /100 | #287 | Tragic 53.5% |
| Alaska Natives | 0.0 /100 | #288 | Tragic 53.4% |
| Immigrants | Ecuador | 0.0 /100 | #289 | Tragic 53.4% |
| Alaskan Athabascans | 0.0 /100 | #290 | Tragic 53.4% |
| Cubans | 0.0 /100 | #291 | Tragic 53.4% |
| Chickasaw | 0.0 /100 | #292 | Tragic 53.3% |
| Blacks/African Americans | 0.0 /100 | #293 | Tragic 53.3% |
| Cherokee | 0.0 /100 | #294 | Tragic 53.2% |
| Yaqui | 0.0 /100 | #295 | Tragic 53.2% |
| Sioux | 0.0 /100 | #296 | Tragic 53.0% |
| Paiute | 0.0 /100 | #297 | Tragic 52.9% |
| Immigrants | Dominica | 0.0 /100 | #298 | Tragic 52.5% |
| Immigrants | Nicaragua | 0.0 /100 | #299 | Tragic 52.4% |
| Choctaw | 0.0 /100 | #300 | Tragic 52.3% |
| Haitians | 0.0 /100 | #301 | Tragic 52.3% |