Immigrants from Afghanistan vs Immigrants from Vietnam Kindergarten
COMPARE
Immigrants from Afghanistan
Immigrants from Vietnam
Kindergarten
Kindergarten Comparison
Immigrants from Afghanistan
Immigrants from Vietnam
97.3%
KINDERGARTEN
0.0/ 100
METRIC RATING
289th/ 347
METRIC RANK
96.7%
KINDERGARTEN
0.0/ 100
METRIC RATING
329th/ 347
METRIC RANK
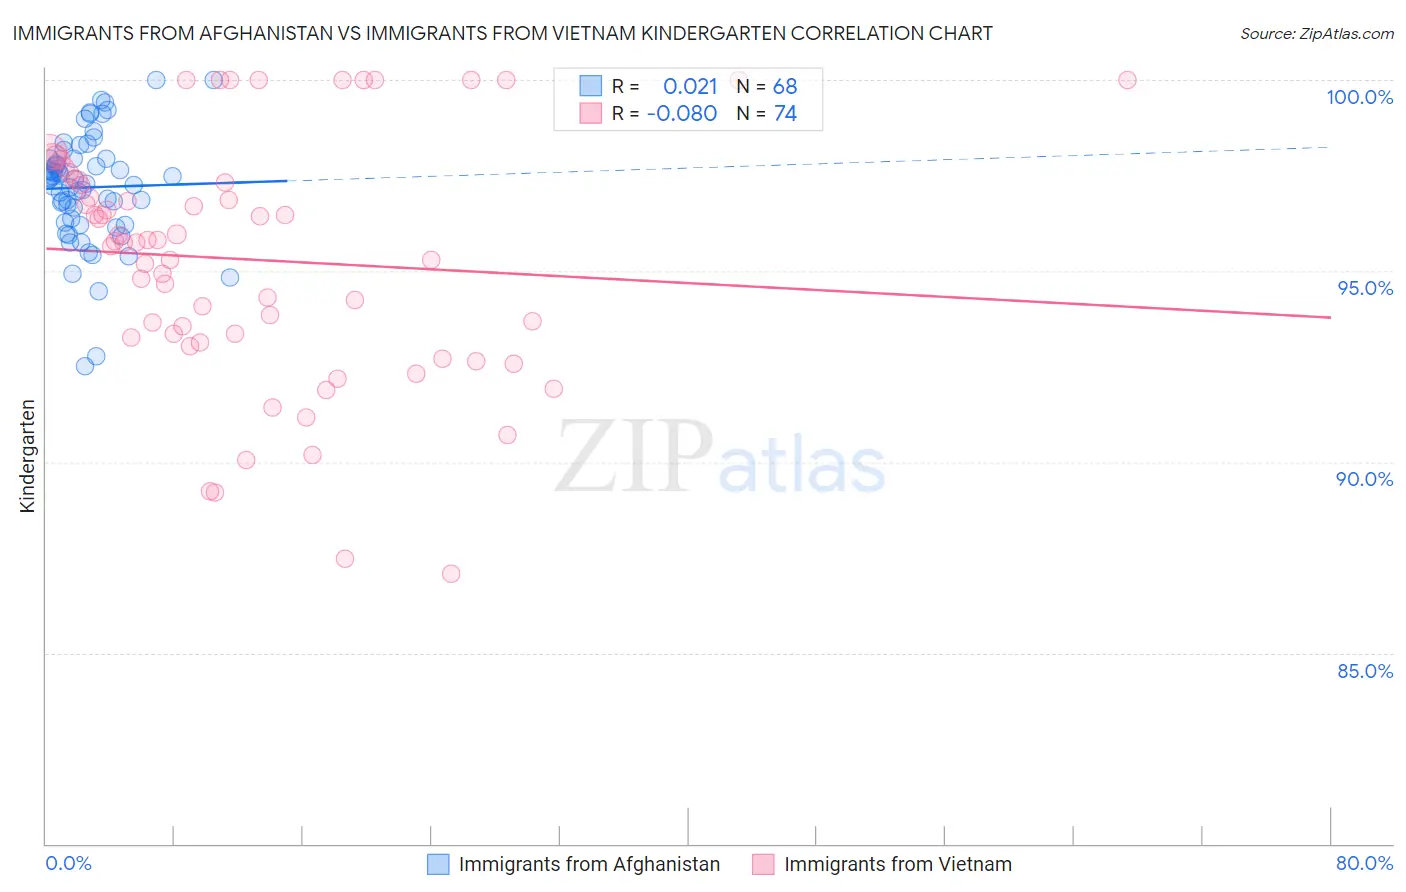
Immigrants from Afghanistan vs Immigrants from Vietnam Kindergarten Correlation Chart
The statistical analysis conducted on geographies consisting of 147,629,924 people shows no correlation between the proportion of Immigrants from Afghanistan and percentage of population with at least kindergarten education in the United States with a correlation coefficient (R) of 0.021 and weighted average of 97.3%. Similarly, the statistical analysis conducted on geographies consisting of 404,844,130 people shows a slight negative correlation between the proportion of Immigrants from Vietnam and percentage of population with at least kindergarten education in the United States with a correlation coefficient (R) of -0.080 and weighted average of 96.7%, a difference of 0.65%.
Kindergarten Correlation Summary
| Measurement | Immigrants from Afghanistan | Immigrants from Vietnam |
| Minimum | 92.5% | 87.1% |
| Maximum | 100.0% | 100.0% |
| Range | 7.5% | 12.9% |
| Mean | 97.2% | 95.3% |
| Median | 97.4% | 95.8% |
| Interquartile 25% (IQ1) | 96.3% | 93.2% |
| Interquartile 75% (IQ3) | 97.9% | 97.4% |
| Interquartile Range (IQR) | 1.6% | 4.1% |
| Standard Deviation (Sample) | 1.5% | 3.2% |
| Standard Deviation (Population) | 1.4% | 3.1% |
Similar Demographics by Kindergarten
Demographics Similar to Immigrants from Afghanistan by Kindergarten
In terms of kindergarten, the demographic groups most similar to Immigrants from Afghanistan are Immigrants from St. Vincent and the Grenadines (97.3%, a difference of 0.010%), Immigrants from Thailand (97.3%, a difference of 0.020%), Immigrants from Barbados (97.3%, a difference of 0.030%), Immigrants from Hong Kong (97.3%, a difference of 0.030%), and Houma (97.3%, a difference of 0.030%).
| Demographics | Rating | Rank | Kindergarten |
| Afghans | 0.0 /100 | #282 | Tragic 97.4% |
| Immigrants | West Indies | 0.0 /100 | #283 | Tragic 97.3% |
| Immigrants | Trinidad and Tobago | 0.0 /100 | #284 | Tragic 97.3% |
| Immigrants | Portugal | 0.0 /100 | #285 | Tragic 97.3% |
| Immigrants | Barbados | 0.0 /100 | #286 | Tragic 97.3% |
| Immigrants | Hong Kong | 0.0 /100 | #287 | Tragic 97.3% |
| Immigrants | Thailand | 0.0 /100 | #288 | Tragic 97.3% |
| Immigrants | Afghanistan | 0.0 /100 | #289 | Tragic 97.3% |
| Immigrants | St. Vincent and the Grenadines | 0.0 /100 | #290 | Tragic 97.3% |
| Houma | 0.0 /100 | #291 | Tragic 97.3% |
| British West Indians | 0.0 /100 | #292 | Tragic 97.3% |
| Malaysians | 0.0 /100 | #293 | Tragic 97.2% |
| Immigrants | Immigrants | 0.0 /100 | #294 | Tragic 97.2% |
| Immigrants | Grenada | 0.0 /100 | #295 | Tragic 97.2% |
| Immigrants | Eritrea | 0.0 /100 | #296 | Tragic 97.2% |
Demographics Similar to Immigrants from Vietnam by Kindergarten
In terms of kindergarten, the demographic groups most similar to Immigrants from Vietnam are Japanese (96.7%, a difference of 0.0%), Immigrants from Armenia (96.6%, a difference of 0.030%), Immigrants from Latin America (96.7%, a difference of 0.040%), Yakama (96.6%, a difference of 0.050%), and Mexican (96.7%, a difference of 0.060%).
| Demographics | Rating | Rank | Kindergarten |
| Mexican American Indians | 0.0 /100 | #322 | Tragic 96.8% |
| Immigrants | Honduras | 0.0 /100 | #323 | Tragic 96.8% |
| Vietnamese | 0.0 /100 | #324 | Tragic 96.8% |
| Indonesians | 0.0 /100 | #325 | Tragic 96.8% |
| Dominicans | 0.0 /100 | #326 | Tragic 96.8% |
| Mexicans | 0.0 /100 | #327 | Tragic 96.7% |
| Immigrants | Latin America | 0.0 /100 | #328 | Tragic 96.7% |
| Immigrants | Vietnam | 0.0 /100 | #329 | Tragic 96.7% |
| Japanese | 0.0 /100 | #330 | Tragic 96.7% |
| Immigrants | Armenia | 0.0 /100 | #331 | Tragic 96.6% |
| Yakama | 0.0 /100 | #332 | Tragic 96.6% |
| Central Americans | 0.0 /100 | #333 | Tragic 96.6% |
| Immigrants | Dominican Republic | 0.0 /100 | #334 | Tragic 96.6% |
| Bangladeshis | 0.0 /100 | #335 | Tragic 96.6% |
| Guatemalans | 0.0 /100 | #336 | Tragic 96.5% |