Immigrants from Afghanistan vs Chickasaw 12th Grade, No Diploma
COMPARE
Immigrants from Afghanistan
Chickasaw
12th Grade, No Diploma
12th Grade, No Diploma Comparison
Immigrants from Afghanistan
Chickasaw
90.6%
12TH GRADE, NO DIPLOMA
11.0/ 100
METRIC RATING
209th/ 347
METRIC RANK
90.3%
12TH GRADE, NO DIPLOMA
4.8/ 100
METRIC RATING
225th/ 347
METRIC RANK
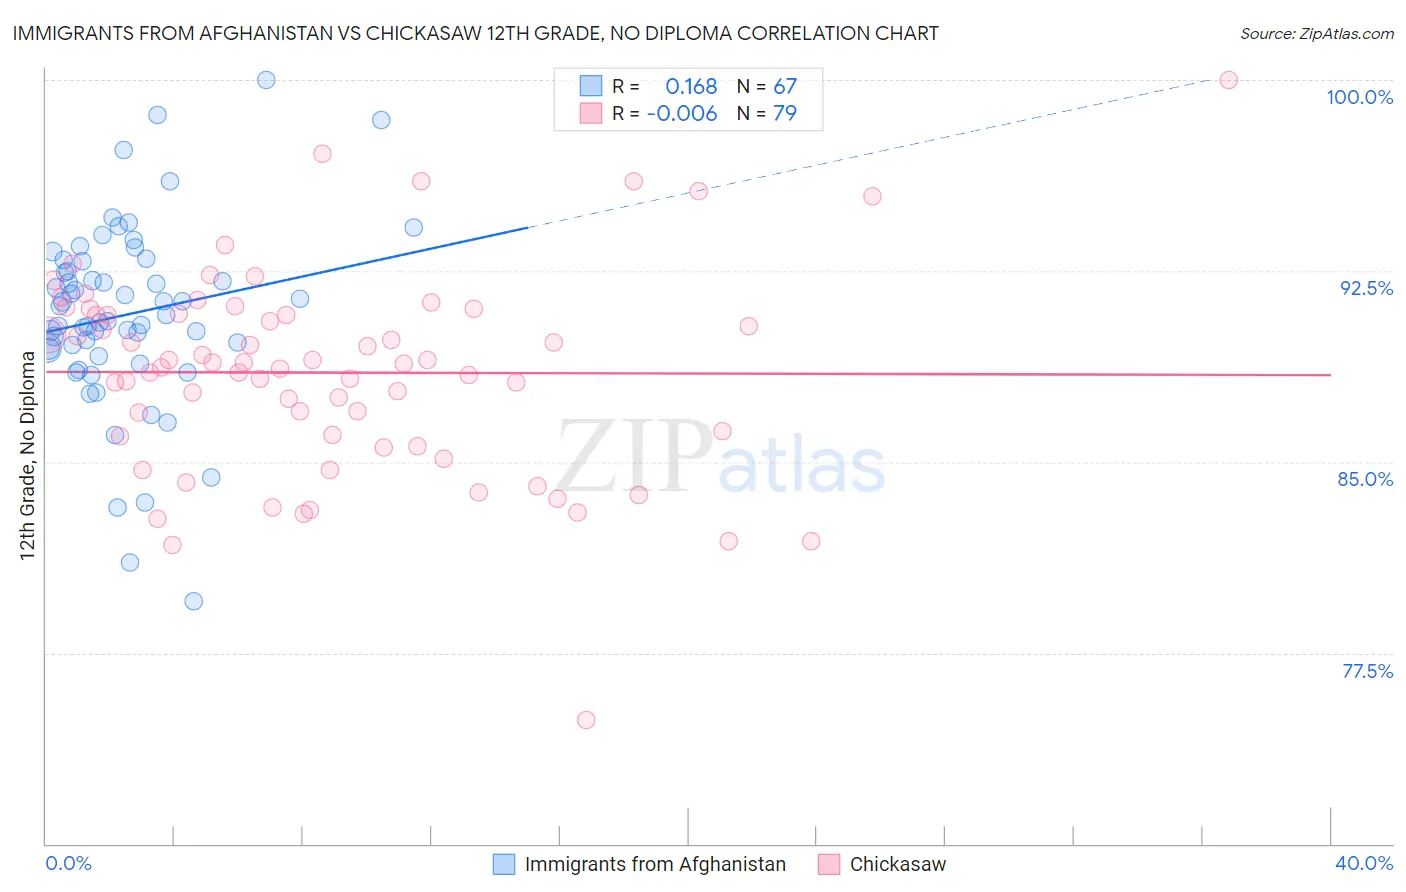
Immigrants from Afghanistan vs Chickasaw 12th Grade, No Diploma Correlation Chart
The statistical analysis conducted on geographies consisting of 147,629,579 people shows a poor positive correlation between the proportion of Immigrants from Afghanistan and percentage of population with at least 12th grade (no diploma) education in the United States with a correlation coefficient (R) of 0.168 and weighted average of 90.6%. Similarly, the statistical analysis conducted on geographies consisting of 147,726,791 people shows no correlation between the proportion of Chickasaw and percentage of population with at least 12th grade (no diploma) education in the United States with a correlation coefficient (R) of -0.006 and weighted average of 90.3%, a difference of 0.28%.
12th Grade, No Diploma Correlation Summary
| Measurement | Immigrants from Afghanistan | Chickasaw |
| Minimum | 79.5% | 74.9% |
| Maximum | 100.0% | 100.0% |
| Range | 20.5% | 25.1% |
| Mean | 90.8% | 88.5% |
| Median | 90.8% | 88.8% |
| Interquartile 25% (IQ1) | 89.5% | 86.0% |
| Interquartile 75% (IQ3) | 92.9% | 90.8% |
| Interquartile Range (IQR) | 3.4% | 4.8% |
| Standard Deviation (Sample) | 3.7% | 4.0% |
| Standard Deviation (Population) | 3.6% | 4.0% |
Demographics Similar to Immigrants from Afghanistan and Chickasaw by 12th Grade, No Diploma
In terms of 12th grade, no diploma, the demographic groups most similar to Immigrants from Afghanistan are Immigrants from Micronesia (90.6%, a difference of 0.0%), South American Indian (90.6%, a difference of 0.0%), Portuguese (90.6%, a difference of 0.010%), Armenian (90.6%, a difference of 0.020%), and Somali (90.6%, a difference of 0.020%). Similarly, the demographic groups most similar to Chickasaw are Immigrants from Panama (90.3%, a difference of 0.0%), Immigrants from Zaire (90.3%, a difference of 0.010%), South American (90.3%, a difference of 0.020%), Nigerian (90.3%, a difference of 0.020%), and Immigrants from Somalia (90.4%, a difference of 0.030%).
| Demographics | Rating | Rank | 12th Grade, No Diploma |
| Armenians | 11.6 /100 | #207 | Poor 90.6% |
| Immigrants | Micronesia | 11.0 /100 | #208 | Poor 90.6% |
| Immigrants | Afghanistan | 11.0 /100 | #209 | Poor 90.6% |
| South American Indians | 10.9 /100 | #210 | Poor 90.6% |
| Portuguese | 10.6 /100 | #211 | Poor 90.6% |
| Somalis | 10.2 /100 | #212 | Poor 90.6% |
| Costa Ricans | 9.4 /100 | #213 | Tragic 90.5% |
| Immigrants | Africa | 8.5 /100 | #214 | Tragic 90.5% |
| Arapaho | 7.7 /100 | #215 | Tragic 90.5% |
| Shoshone | 7.5 /100 | #216 | Tragic 90.5% |
| Cherokee | 7.4 /100 | #217 | Tragic 90.5% |
| Immigrants | Cameroon | 7.4 /100 | #218 | Tragic 90.5% |
| Uruguayans | 7.0 /100 | #219 | Tragic 90.4% |
| Colombians | 6.6 /100 | #220 | Tragic 90.4% |
| Immigrants | Liberia | 5.7 /100 | #221 | Tragic 90.4% |
| Immigrants | Somalia | 5.3 /100 | #222 | Tragic 90.4% |
| South Americans | 5.0 /100 | #223 | Tragic 90.3% |
| Immigrants | Panama | 4.8 /100 | #224 | Tragic 90.3% |
| Chickasaw | 4.8 /100 | #225 | Tragic 90.3% |
| Immigrants | Zaire | 4.6 /100 | #226 | Tragic 90.3% |
| Nigerians | 4.5 /100 | #227 | Tragic 90.3% |