Welsh vs Chickasaw 12th Grade, No Diploma
COMPARE
Welsh
Chickasaw
12th Grade, No Diploma
12th Grade, No Diploma Comparison
Welsh
Chickasaw
92.8%
12TH GRADE, NO DIPLOMA
99.7/ 100
METRIC RATING
55th/ 347
METRIC RANK
90.3%
12TH GRADE, NO DIPLOMA
4.8/ 100
METRIC RATING
225th/ 347
METRIC RANK
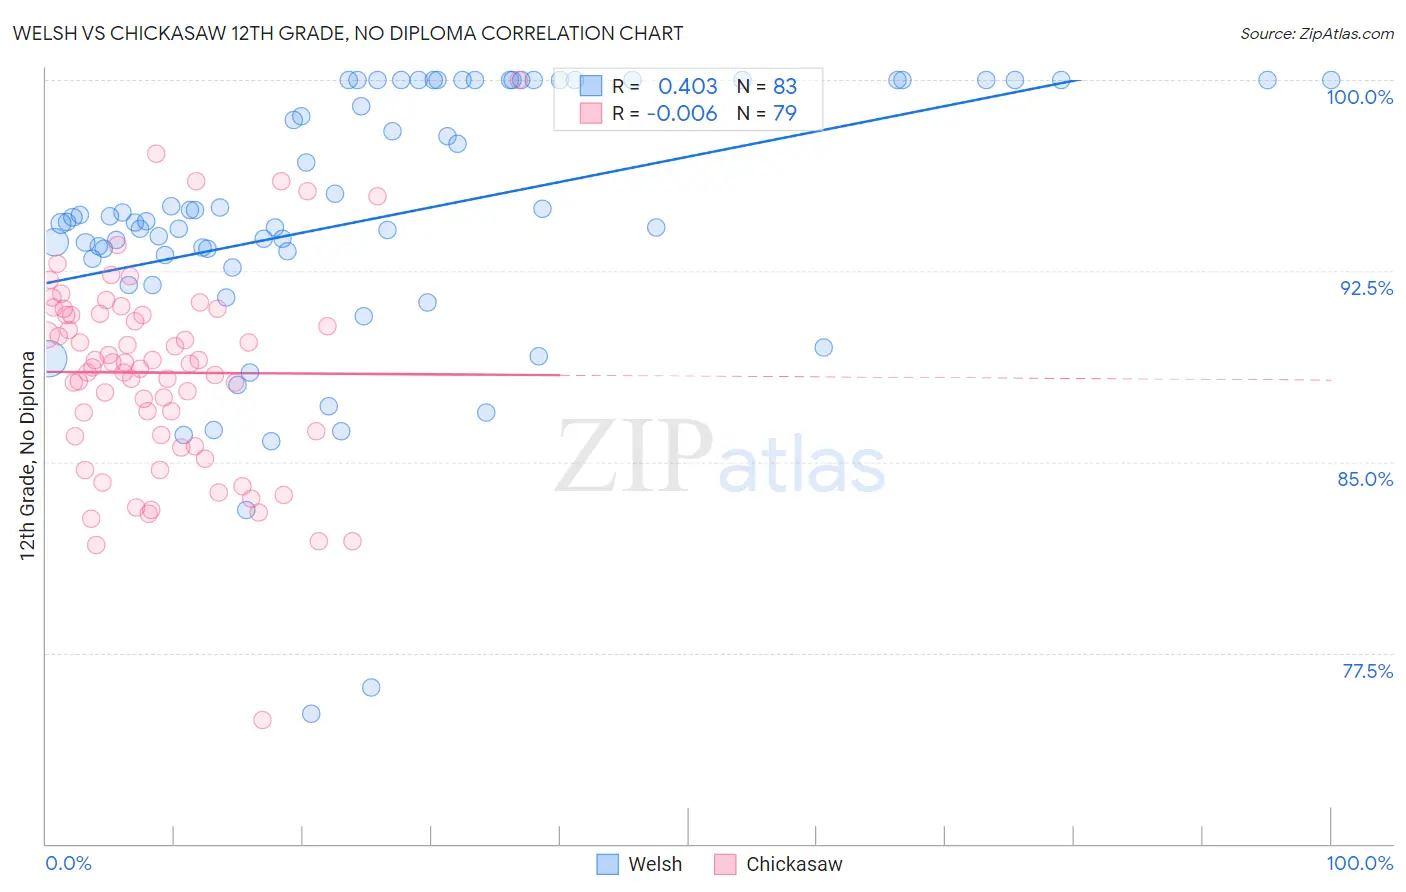
Welsh vs Chickasaw 12th Grade, No Diploma Correlation Chart
The statistical analysis conducted on geographies consisting of 528,596,196 people shows a moderate positive correlation between the proportion of Welsh and percentage of population with at least 12th grade (no diploma) education in the United States with a correlation coefficient (R) of 0.403 and weighted average of 92.8%. Similarly, the statistical analysis conducted on geographies consisting of 147,726,791 people shows no correlation between the proportion of Chickasaw and percentage of population with at least 12th grade (no diploma) education in the United States with a correlation coefficient (R) of -0.006 and weighted average of 90.3%, a difference of 2.8%.
12th Grade, No Diploma Correlation Summary
| Measurement | Welsh | Chickasaw |
| Minimum | 75.1% | 74.9% |
| Maximum | 100.0% | 100.0% |
| Range | 24.9% | 25.1% |
| Mean | 94.5% | 88.5% |
| Median | 94.4% | 88.8% |
| Interquartile 25% (IQ1) | 93.0% | 86.0% |
| Interquartile 75% (IQ3) | 100.0% | 90.8% |
| Interquartile Range (IQR) | 7.0% | 4.8% |
| Standard Deviation (Sample) | 5.3% | 4.0% |
| Standard Deviation (Population) | 5.2% | 4.0% |
Similar Demographics by 12th Grade, No Diploma
Demographics Similar to Welsh by 12th Grade, No Diploma
In terms of 12th grade, no diploma, the demographic groups most similar to Welsh are Serbian (92.8%, a difference of 0.0%), Hungarian (92.8%, a difference of 0.0%), New Zealander (92.8%, a difference of 0.010%), Immigrants from Sweden (92.8%, a difference of 0.020%), and Tsimshian (92.9%, a difference of 0.030%).
| Demographics | Rating | Rank | 12th Grade, No Diploma |
| Australians | 99.8 /100 | #48 | Exceptional 92.9% |
| Macedonians | 99.8 /100 | #49 | Exceptional 92.9% |
| Tsimshian | 99.8 /100 | #50 | Exceptional 92.9% |
| Immigrants | Belgium | 99.8 /100 | #51 | Exceptional 92.9% |
| Immigrants | Sweden | 99.8 /100 | #52 | Exceptional 92.8% |
| Serbians | 99.7 /100 | #53 | Exceptional 92.8% |
| Hungarians | 99.7 /100 | #54 | Exceptional 92.8% |
| Welsh | 99.7 /100 | #55 | Exceptional 92.8% |
| New Zealanders | 99.7 /100 | #56 | Exceptional 92.8% |
| Immigrants | Canada | 99.7 /100 | #57 | Exceptional 92.8% |
| Immigrants | Taiwan | 99.7 /100 | #58 | Exceptional 92.8% |
| Immigrants | North America | 99.7 /100 | #59 | Exceptional 92.8% |
| Slavs | 99.7 /100 | #60 | Exceptional 92.8% |
| Immigrants | Japan | 99.7 /100 | #61 | Exceptional 92.8% |
| Ukrainians | 99.6 /100 | #62 | Exceptional 92.7% |
Demographics Similar to Chickasaw by 12th Grade, No Diploma
In terms of 12th grade, no diploma, the demographic groups most similar to Chickasaw are Immigrants from Panama (90.3%, a difference of 0.0%), Immigrants from Zaire (90.3%, a difference of 0.010%), South American (90.3%, a difference of 0.020%), Nigerian (90.3%, a difference of 0.020%), and Immigrants from Somalia (90.4%, a difference of 0.030%).
| Demographics | Rating | Rank | 12th Grade, No Diploma |
| Immigrants | Cameroon | 7.4 /100 | #218 | Tragic 90.5% |
| Uruguayans | 7.0 /100 | #219 | Tragic 90.4% |
| Colombians | 6.6 /100 | #220 | Tragic 90.4% |
| Immigrants | Liberia | 5.7 /100 | #221 | Tragic 90.4% |
| Immigrants | Somalia | 5.3 /100 | #222 | Tragic 90.4% |
| South Americans | 5.0 /100 | #223 | Tragic 90.3% |
| Immigrants | Panama | 4.8 /100 | #224 | Tragic 90.3% |
| Chickasaw | 4.8 /100 | #225 | Tragic 90.3% |
| Immigrants | Zaire | 4.6 /100 | #226 | Tragic 90.3% |
| Nigerians | 4.5 /100 | #227 | Tragic 90.3% |
| Creek | 3.9 /100 | #228 | Tragic 90.3% |
| Immigrants | Bahamas | 3.6 /100 | #229 | Tragic 90.2% |
| Immigrants | Philippines | 2.8 /100 | #230 | Tragic 90.2% |
| Peruvians | 2.7 /100 | #231 | Tragic 90.2% |
| Blackfeet | 2.4 /100 | #232 | Tragic 90.1% |