Immigrants from Afghanistan vs Immigrants from Uganda 12th Grade, No Diploma
COMPARE
Immigrants from Afghanistan
Immigrants from Uganda
12th Grade, No Diploma
12th Grade, No Diploma Comparison
Immigrants from Afghanistan
Immigrants from Uganda
90.6%
12TH GRADE, NO DIPLOMA
11.0/ 100
METRIC RATING
209th/ 347
METRIC RANK
90.9%
12TH GRADE, NO DIPLOMA
31.6/ 100
METRIC RATING
189th/ 347
METRIC RANK
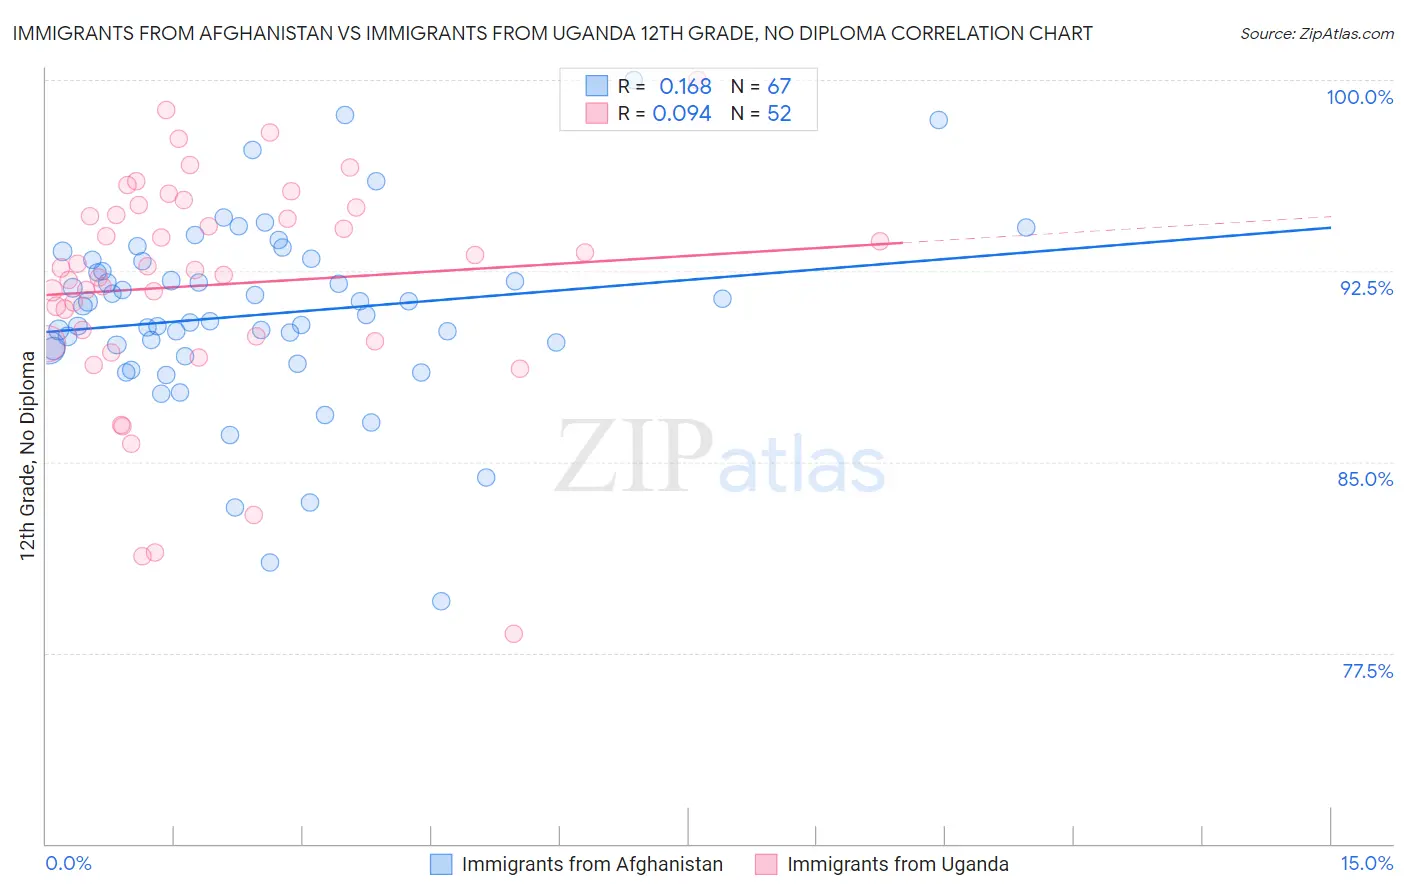
Immigrants from Afghanistan vs Immigrants from Uganda 12th Grade, No Diploma Correlation Chart
The statistical analysis conducted on geographies consisting of 147,629,579 people shows a poor positive correlation between the proportion of Immigrants from Afghanistan and percentage of population with at least 12th grade (no diploma) education in the United States with a correlation coefficient (R) of 0.168 and weighted average of 90.6%. Similarly, the statistical analysis conducted on geographies consisting of 125,969,169 people shows a slight positive correlation between the proportion of Immigrants from Uganda and percentage of population with at least 12th grade (no diploma) education in the United States with a correlation coefficient (R) of 0.094 and weighted average of 90.9%, a difference of 0.41%.
12th Grade, No Diploma Correlation Summary
| Measurement | Immigrants from Afghanistan | Immigrants from Uganda |
| Minimum | 79.5% | 78.2% |
| Maximum | 100.0% | 100.0% |
| Range | 20.5% | 21.8% |
| Mean | 90.8% | 92.0% |
| Median | 90.8% | 92.6% |
| Interquartile 25% (IQ1) | 89.5% | 89.9% |
| Interquartile 75% (IQ3) | 92.9% | 94.9% |
| Interquartile Range (IQR) | 3.4% | 5.0% |
| Standard Deviation (Sample) | 3.7% | 4.4% |
| Standard Deviation (Population) | 3.6% | 4.4% |
Demographics Similar to Immigrants from Afghanistan and Immigrants from Uganda by 12th Grade, No Diploma
In terms of 12th grade, no diploma, the demographic groups most similar to Immigrants from Afghanistan are Immigrants from Micronesia (90.6%, a difference of 0.0%), Armenian (90.6%, a difference of 0.020%), Immigrants from Bolivia (90.6%, a difference of 0.040%), Immigrants from Sierra Leone (90.7%, a difference of 0.11%), and French American Indian (90.7%, a difference of 0.12%). Similarly, the demographic groups most similar to Immigrants from Uganda are Afghan (90.9%, a difference of 0.030%), Moroccan (90.9%, a difference of 0.040%), Immigrants from Eastern Africa (90.9%, a difference of 0.060%), Immigrants from Ethiopia (90.9%, a difference of 0.070%), and Immigrants from Oceania (90.9%, a difference of 0.080%).
| Demographics | Rating | Rank | 12th Grade, No Diploma |
| Immigrants | Uganda | 31.6 /100 | #189 | Fair 90.9% |
| Afghans | 29.9 /100 | #190 | Fair 90.9% |
| Moroccans | 28.8 /100 | #191 | Fair 90.9% |
| Immigrants | Eastern Africa | 27.7 /100 | #192 | Fair 90.9% |
| Immigrants | Ethiopia | 27.2 /100 | #193 | Fair 90.9% |
| Immigrants | Oceania | 26.0 /100 | #194 | Fair 90.9% |
| Koreans | 24.5 /100 | #195 | Fair 90.8% |
| Panamanians | 22.8 /100 | #196 | Fair 90.8% |
| Immigrants | Sudan | 22.6 /100 | #197 | Fair 90.8% |
| Samoans | 20.4 /100 | #198 | Fair 90.8% |
| Immigrants | Southern Europe | 19.9 /100 | #199 | Poor 90.8% |
| Liberians | 19.8 /100 | #200 | Poor 90.8% |
| Hawaiians | 19.7 /100 | #201 | Poor 90.8% |
| Marshallese | 18.2 /100 | #202 | Poor 90.7% |
| Tongans | 16.1 /100 | #203 | Poor 90.7% |
| French American Indians | 15.5 /100 | #204 | Poor 90.7% |
| Immigrants | Sierra Leone | 14.9 /100 | #205 | Poor 90.7% |
| Immigrants | Bolivia | 12.3 /100 | #206 | Poor 90.6% |
| Armenians | 11.6 /100 | #207 | Poor 90.6% |
| Immigrants | Micronesia | 11.0 /100 | #208 | Poor 90.6% |
| Immigrants | Afghanistan | 11.0 /100 | #209 | Poor 90.6% |