Icelander vs Comanche 11th Grade
COMPARE
Icelander
Comanche
11th Grade
11th Grade Comparison
Icelanders
Comanche
93.6%
11TH GRADE
99.3/ 100
METRIC RATING
83rd/ 347
METRIC RANK
91.7%
11TH GRADE
2.6/ 100
METRIC RATING
238th/ 347
METRIC RANK
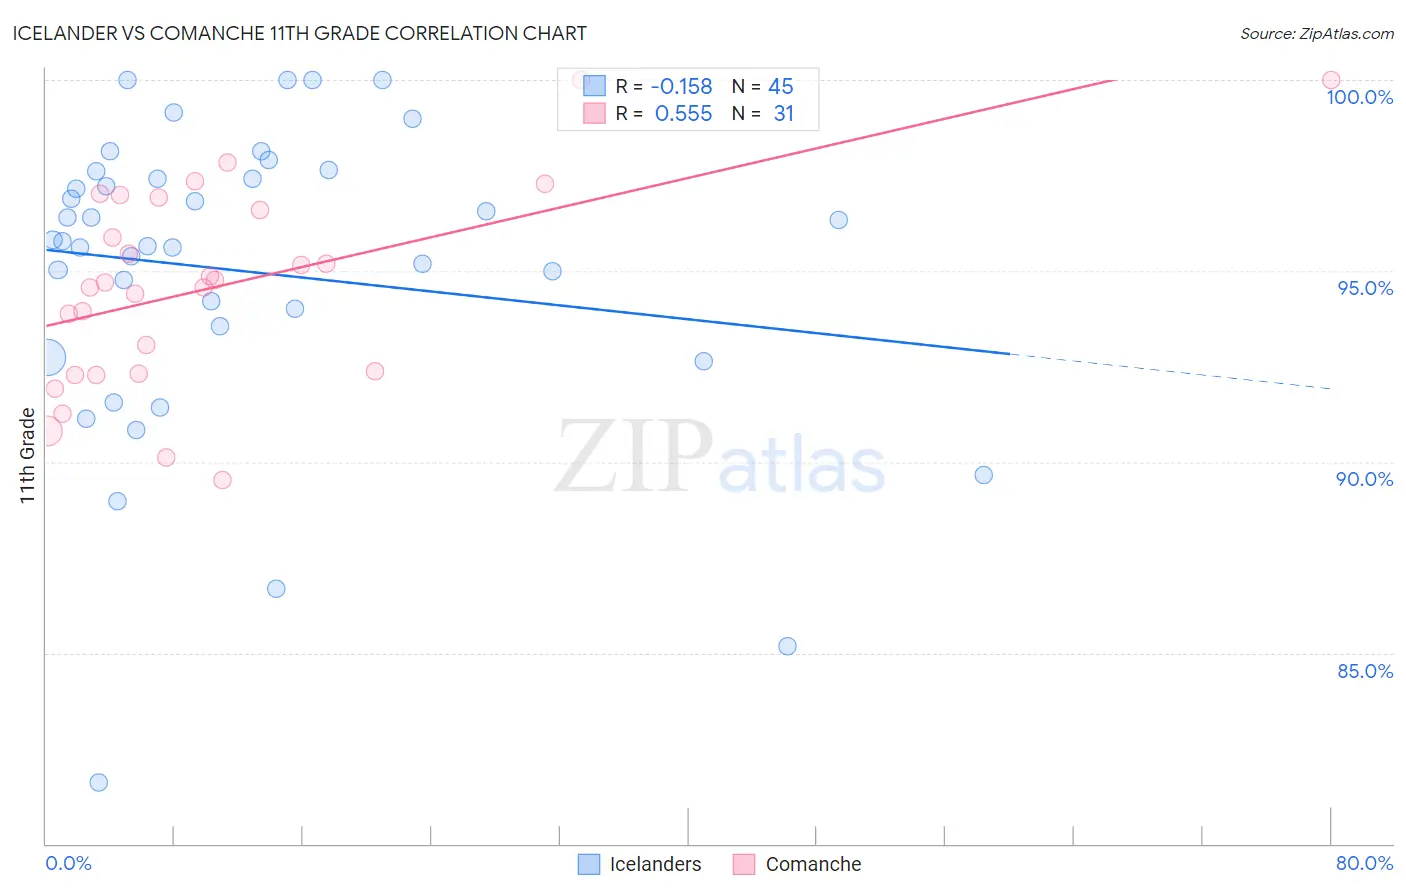
Icelander vs Comanche 11th Grade Correlation Chart
The statistical analysis conducted on geographies consisting of 159,668,816 people shows a poor negative correlation between the proportion of Icelanders and percentage of population with at least 11th grade education in the United States with a correlation coefficient (R) of -0.158 and weighted average of 93.6%. Similarly, the statistical analysis conducted on geographies consisting of 109,786,530 people shows a substantial positive correlation between the proportion of Comanche and percentage of population with at least 11th grade education in the United States with a correlation coefficient (R) of 0.555 and weighted average of 91.7%, a difference of 2.1%.
11th Grade Correlation Summary
| Measurement | Icelander | Comanche |
| Minimum | 81.6% | 89.5% |
| Maximum | 100.0% | 100.0% |
| Range | 18.4% | 10.5% |
| Mean | 95.0% | 94.6% |
| Median | 95.8% | 94.7% |
| Interquartile 25% (IQ1) | 93.1% | 92.3% |
| Interquartile 75% (IQ3) | 97.5% | 96.9% |
| Interquartile Range (IQR) | 4.4% | 4.6% |
| Standard Deviation (Sample) | 4.0% | 2.6% |
| Standard Deviation (Population) | 3.9% | 2.6% |
Similar Demographics by 11th Grade
Demographics Similar to Icelanders by 11th Grade
In terms of 11th grade, the demographic groups most similar to Icelanders are Immigrants from Taiwan (93.6%, a difference of 0.0%), Immigrants from Saudi Arabia (93.7%, a difference of 0.010%), Immigrants from Switzerland (93.6%, a difference of 0.010%), Immigrants from South Central Asia (93.6%, a difference of 0.010%), and Immigrants from Western Europe (93.6%, a difference of 0.020%).
| Demographics | Rating | Rank | 11th Grade |
| Celtics | 99.5 /100 | #76 | Exceptional 93.7% |
| Aleuts | 99.5 /100 | #77 | Exceptional 93.7% |
| Soviet Union | 99.5 /100 | #78 | Exceptional 93.7% |
| Immigrants | Denmark | 99.5 /100 | #79 | Exceptional 93.7% |
| Canadians | 99.5 /100 | #80 | Exceptional 93.7% |
| Immigrants | Moldova | 99.5 /100 | #81 | Exceptional 93.7% |
| Immigrants | Saudi Arabia | 99.3 /100 | #82 | Exceptional 93.7% |
| Icelanders | 99.3 /100 | #83 | Exceptional 93.6% |
| Immigrants | Taiwan | 99.3 /100 | #84 | Exceptional 93.6% |
| Immigrants | Switzerland | 99.3 /100 | #85 | Exceptional 93.6% |
| Immigrants | South Central Asia | 99.2 /100 | #86 | Exceptional 93.6% |
| Immigrants | Western Europe | 99.2 /100 | #87 | Exceptional 93.6% |
| Cambodians | 99.2 /100 | #88 | Exceptional 93.6% |
| Burmese | 99.2 /100 | #89 | Exceptional 93.6% |
| Ottawa | 99.2 /100 | #90 | Exceptional 93.6% |
Demographics Similar to Comanche by 11th Grade
In terms of 11th grade, the demographic groups most similar to Comanche are Hopi (91.7%, a difference of 0.0%), Colombian (91.7%, a difference of 0.020%), Immigrants from Bolivia (91.7%, a difference of 0.020%), Armenian (91.7%, a difference of 0.030%), and Subsaharan African (91.7%, a difference of 0.030%).
| Demographics | Rating | Rank | 11th Grade |
| Choctaw | 3.7 /100 | #231 | Tragic 91.8% |
| Uruguayans | 3.5 /100 | #232 | Tragic 91.8% |
| Cheyenne | 3.3 /100 | #233 | Tragic 91.8% |
| Armenians | 2.9 /100 | #234 | Tragic 91.7% |
| Sub-Saharan Africans | 2.9 /100 | #235 | Tragic 91.7% |
| Colombians | 2.8 /100 | #236 | Tragic 91.7% |
| Immigrants | Bolivia | 2.8 /100 | #237 | Tragic 91.7% |
| Comanche | 2.6 /100 | #238 | Tragic 91.7% |
| Hopi | 2.5 /100 | #239 | Tragic 91.7% |
| South Americans | 2.0 /100 | #240 | Tragic 91.6% |
| Bahamians | 1.8 /100 | #241 | Tragic 91.6% |
| Immigrants | Middle Africa | 1.6 /100 | #242 | Tragic 91.6% |
| Immigrants | Thailand | 1.4 /100 | #243 | Tragic 91.6% |
| Senegalese | 1.4 /100 | #244 | Tragic 91.6% |
| Africans | 1.3 /100 | #245 | Tragic 91.5% |