Croatian vs Immigrants from Chile 11th Grade
COMPARE
Croatian
Immigrants from Chile
11th Grade
11th Grade Comparison
Croatians
Immigrants from Chile
94.7%
11TH GRADE
100.0/ 100
METRIC RATING
8th/ 347
METRIC RANK
92.4%
11TH GRADE
33.3/ 100
METRIC RATING
189th/ 347
METRIC RANK
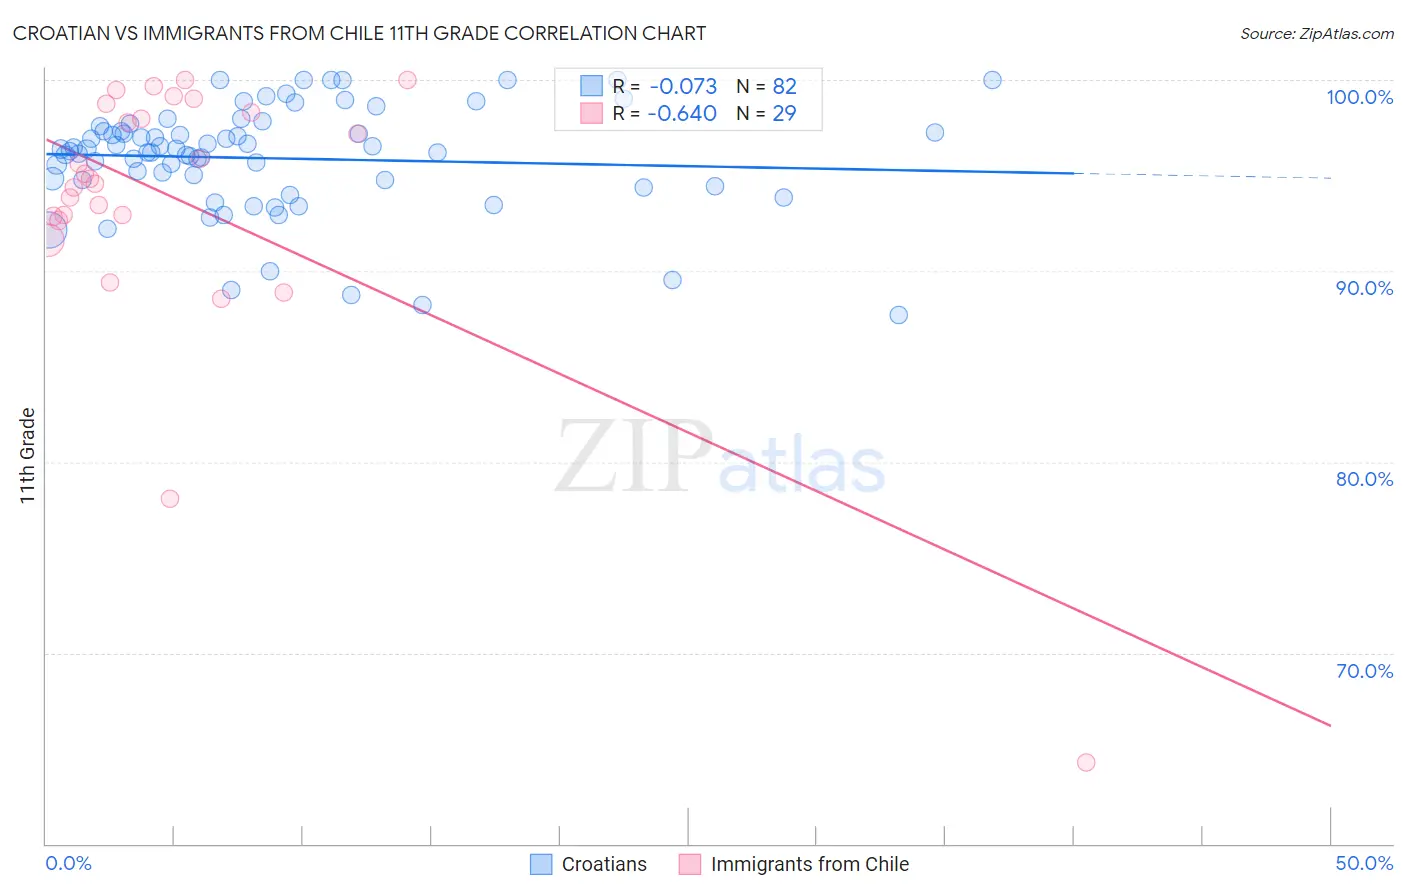
Croatian vs Immigrants from Chile 11th Grade Correlation Chart
The statistical analysis conducted on geographies consisting of 375,734,068 people shows a slight negative correlation between the proportion of Croatians and percentage of population with at least 11th grade education in the United States with a correlation coefficient (R) of -0.073 and weighted average of 94.7%. Similarly, the statistical analysis conducted on geographies consisting of 218,647,266 people shows a significant negative correlation between the proportion of Immigrants from Chile and percentage of population with at least 11th grade education in the United States with a correlation coefficient (R) of -0.640 and weighted average of 92.4%, a difference of 2.6%.
11th Grade Correlation Summary
| Measurement | Croatian | Immigrants from Chile |
| Minimum | 87.7% | 64.3% |
| Maximum | 100.0% | 100.0% |
| Range | 12.3% | 35.7% |
| Mean | 95.9% | 93.7% |
| Median | 96.3% | 94.8% |
| Interquartile 25% (IQ1) | 94.7% | 92.8% |
| Interquartile 75% (IQ3) | 97.3% | 98.5% |
| Interquartile Range (IQR) | 2.6% | 5.8% |
| Standard Deviation (Sample) | 2.8% | 7.3% |
| Standard Deviation (Population) | 2.8% | 7.2% |
Similar Demographics by 11th Grade
Demographics Similar to Croatians by 11th Grade
In terms of 11th grade, the demographic groups most similar to Croatians are Polish (94.8%, a difference of 0.010%), Danish (94.7%, a difference of 0.040%), Lithuanian (94.8%, a difference of 0.060%), Finnish (94.7%, a difference of 0.090%), and German (94.7%, a difference of 0.090%).
| Demographics | Rating | Rank | 11th Grade |
| Norwegians | 100.0 /100 | #1 | Exceptional 95.2% |
| Swedes | 100.0 /100 | #2 | Exceptional 94.9% |
| Slovenes | 100.0 /100 | #3 | Exceptional 94.9% |
| Slovaks | 100.0 /100 | #4 | Exceptional 94.9% |
| Carpatho Rusyns | 100.0 /100 | #5 | Exceptional 94.8% |
| Lithuanians | 100.0 /100 | #6 | Exceptional 94.8% |
| Poles | 100.0 /100 | #7 | Exceptional 94.8% |
| Croatians | 100.0 /100 | #8 | Exceptional 94.7% |
| Danes | 100.0 /100 | #9 | Exceptional 94.7% |
| Finns | 100.0 /100 | #10 | Exceptional 94.7% |
| Germans | 100.0 /100 | #11 | Exceptional 94.7% |
| Latvians | 100.0 /100 | #12 | Exceptional 94.7% |
| Chinese | 100.0 /100 | #13 | Exceptional 94.6% |
| Eastern Europeans | 100.0 /100 | #14 | Exceptional 94.6% |
| Bulgarians | 100.0 /100 | #15 | Exceptional 94.5% |
Demographics Similar to Immigrants from Chile by 11th Grade
In terms of 11th grade, the demographic groups most similar to Immigrants from Chile are Immigrants from Indonesia (92.4%, a difference of 0.0%), Arapaho (92.4%, a difference of 0.020%), Immigrants from Western Asia (92.4%, a difference of 0.020%), Chickasaw (92.3%, a difference of 0.020%), and Immigrants from Nepal (92.4%, a difference of 0.030%).
| Demographics | Rating | Rank | 11th Grade |
| Immigrants | Morocco | 38.6 /100 | #182 | Fair 92.4% |
| Immigrants | Malaysia | 37.6 /100 | #183 | Fair 92.4% |
| Immigrants | Asia | 37.4 /100 | #184 | Fair 92.4% |
| Immigrants | Nepal | 36.4 /100 | #185 | Fair 92.4% |
| Arapaho | 35.1 /100 | #186 | Fair 92.4% |
| Immigrants | Western Asia | 35.0 /100 | #187 | Fair 92.4% |
| Immigrants | Indonesia | 33.7 /100 | #188 | Fair 92.4% |
| Immigrants | Chile | 33.3 /100 | #189 | Fair 92.4% |
| Chickasaw | 31.4 /100 | #190 | Fair 92.3% |
| French American Indians | 30.8 /100 | #191 | Fair 92.3% |
| Immigrants | Syria | 30.4 /100 | #192 | Fair 92.3% |
| Moroccans | 28.7 /100 | #193 | Fair 92.3% |
| Sioux | 28.5 /100 | #194 | Fair 92.3% |
| Liberians | 26.8 /100 | #195 | Fair 92.3% |
| Panamanians | 26.4 /100 | #196 | Fair 92.3% |