Icelander vs Czechoslovakian 11th Grade
COMPARE
Icelander
Czechoslovakian
11th Grade
11th Grade Comparison
Icelanders
Czechoslovakians
93.6%
11TH GRADE
99.3/ 100
METRIC RATING
83rd/ 347
METRIC RANK
94.0%
11TH GRADE
99.9/ 100
METRIC RATING
55th/ 347
METRIC RANK
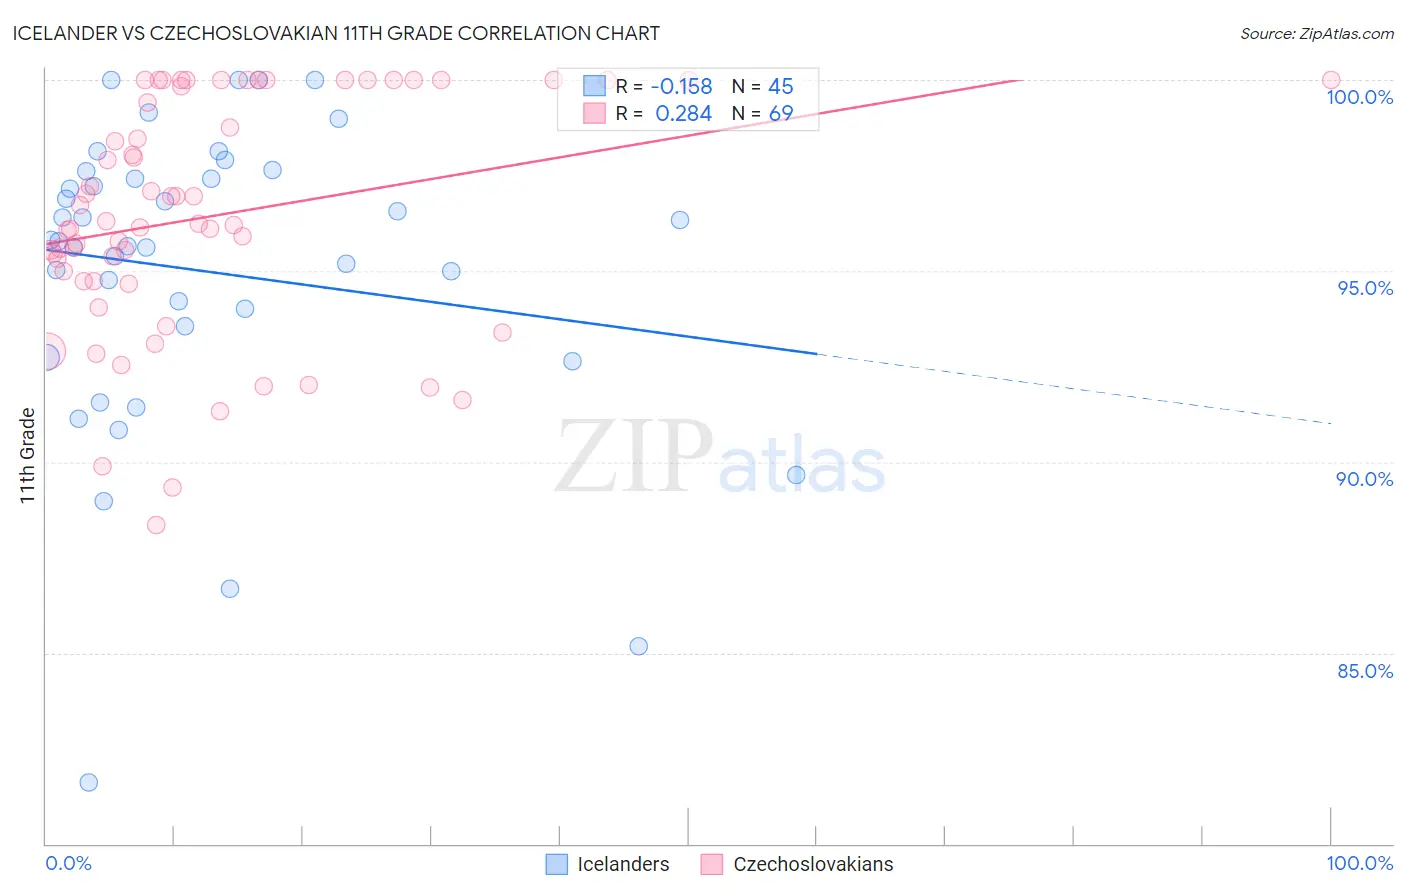
Icelander vs Czechoslovakian 11th Grade Correlation Chart
The statistical analysis conducted on geographies consisting of 159,668,816 people shows a poor negative correlation between the proportion of Icelanders and percentage of population with at least 11th grade education in the United States with a correlation coefficient (R) of -0.158 and weighted average of 93.6%. Similarly, the statistical analysis conducted on geographies consisting of 368,668,876 people shows a weak positive correlation between the proportion of Czechoslovakians and percentage of population with at least 11th grade education in the United States with a correlation coefficient (R) of 0.284 and weighted average of 94.0%, a difference of 0.39%.
11th Grade Correlation Summary
| Measurement | Icelander | Czechoslovakian |
| Minimum | 81.6% | 88.3% |
| Maximum | 100.0% | 100.0% |
| Range | 18.4% | 11.7% |
| Mean | 95.0% | 96.4% |
| Median | 95.8% | 96.2% |
| Interquartile 25% (IQ1) | 93.1% | 94.7% |
| Interquartile 75% (IQ3) | 97.5% | 100.0% |
| Interquartile Range (IQR) | 4.4% | 5.3% |
| Standard Deviation (Sample) | 4.0% | 3.1% |
| Standard Deviation (Population) | 3.9% | 3.0% |
Similar Demographics by 11th Grade
Demographics Similar to Icelanders by 11th Grade
In terms of 11th grade, the demographic groups most similar to Icelanders are Immigrants from Taiwan (93.6%, a difference of 0.0%), Immigrants from Saudi Arabia (93.7%, a difference of 0.010%), Immigrants from Switzerland (93.6%, a difference of 0.010%), Immigrants from South Central Asia (93.6%, a difference of 0.010%), and Immigrants from Western Europe (93.6%, a difference of 0.020%).
| Demographics | Rating | Rank | 11th Grade |
| Celtics | 99.5 /100 | #76 | Exceptional 93.7% |
| Aleuts | 99.5 /100 | #77 | Exceptional 93.7% |
| Soviet Union | 99.5 /100 | #78 | Exceptional 93.7% |
| Immigrants | Denmark | 99.5 /100 | #79 | Exceptional 93.7% |
| Canadians | 99.5 /100 | #80 | Exceptional 93.7% |
| Immigrants | Moldova | 99.5 /100 | #81 | Exceptional 93.7% |
| Immigrants | Saudi Arabia | 99.3 /100 | #82 | Exceptional 93.7% |
| Icelanders | 99.3 /100 | #83 | Exceptional 93.6% |
| Immigrants | Taiwan | 99.3 /100 | #84 | Exceptional 93.6% |
| Immigrants | Switzerland | 99.3 /100 | #85 | Exceptional 93.6% |
| Immigrants | South Central Asia | 99.2 /100 | #86 | Exceptional 93.6% |
| Immigrants | Western Europe | 99.2 /100 | #87 | Exceptional 93.6% |
| Cambodians | 99.2 /100 | #88 | Exceptional 93.6% |
| Burmese | 99.2 /100 | #89 | Exceptional 93.6% |
| Ottawa | 99.2 /100 | #90 | Exceptional 93.6% |
Demographics Similar to Czechoslovakians by 11th Grade
In terms of 11th grade, the demographic groups most similar to Czechoslovakians are Immigrants from North America (94.0%, a difference of 0.0%), Immigrants from Australia (94.0%, a difference of 0.010%), French Canadian (94.0%, a difference of 0.010%), New Zealander (94.0%, a difference of 0.010%), and Iranian (94.0%, a difference of 0.010%).
| Demographics | Rating | Rank | 11th Grade |
| Macedonians | 99.9 /100 | #48 | Exceptional 94.1% |
| Slavs | 99.9 /100 | #49 | Exceptional 94.1% |
| French | 99.9 /100 | #50 | Exceptional 94.1% |
| Turks | 99.9 /100 | #51 | Exceptional 94.0% |
| Immigrants | Canada | 99.9 /100 | #52 | Exceptional 94.0% |
| Immigrants | Australia | 99.9 /100 | #53 | Exceptional 94.0% |
| Immigrants | North America | 99.9 /100 | #54 | Exceptional 94.0% |
| Czechoslovakians | 99.9 /100 | #55 | Exceptional 94.0% |
| French Canadians | 99.9 /100 | #56 | Exceptional 94.0% |
| New Zealanders | 99.9 /100 | #57 | Exceptional 94.0% |
| Iranians | 99.9 /100 | #58 | Exceptional 94.0% |
| Bhutanese | 99.8 /100 | #59 | Exceptional 94.0% |
| Okinawans | 99.8 /100 | #60 | Exceptional 94.0% |
| Immigrants | Belgium | 99.8 /100 | #61 | Exceptional 94.0% |
| Austrians | 99.8 /100 | #62 | Exceptional 94.0% |