Immigrants from Canada vs Creek Master's Degree
COMPARE
Immigrants from Canada
Creek
Master's Degree
Master's Degree Comparison
Immigrants from Canada
Creek
17.2%
MASTER'S DEGREE
99.2/ 100
METRIC RATING
88th/ 347
METRIC RANK
10.5%
MASTER'S DEGREE
0.0/ 100
METRIC RATING
326th/ 347
METRIC RANK
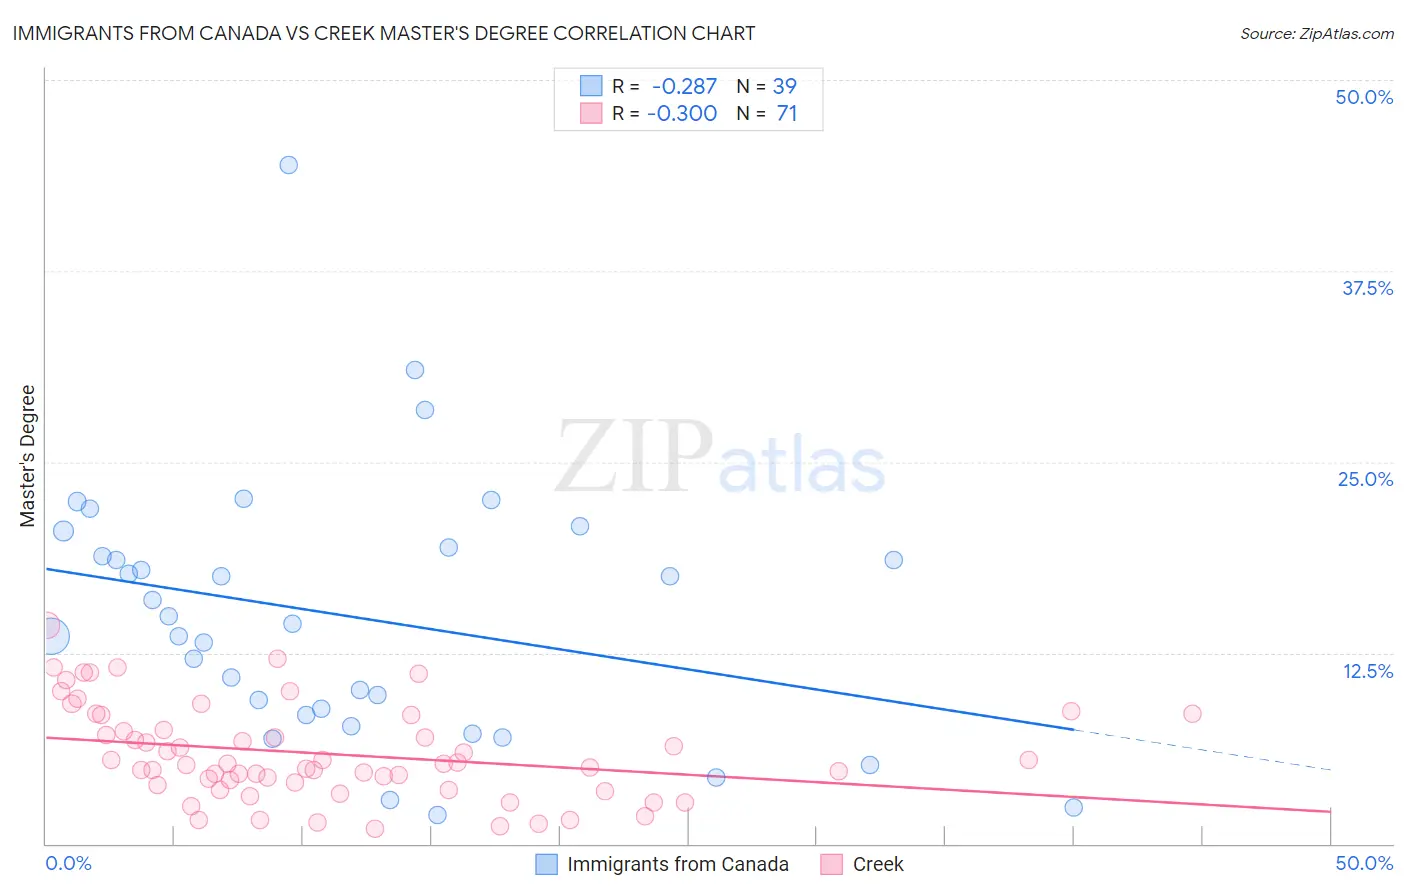
Immigrants from Canada vs Creek Master's Degree Correlation Chart
The statistical analysis conducted on geographies consisting of 459,222,681 people shows a weak negative correlation between the proportion of Immigrants from Canada and percentage of population with at least master's degree education in the United States with a correlation coefficient (R) of -0.287 and weighted average of 17.2%. Similarly, the statistical analysis conducted on geographies consisting of 178,384,928 people shows a weak negative correlation between the proportion of Creek and percentage of population with at least master's degree education in the United States with a correlation coefficient (R) of -0.300 and weighted average of 10.5%, a difference of 63.6%.
Master's Degree Correlation Summary
| Measurement | Immigrants from Canada | Creek |
| Minimum | 1.9% | 0.96% |
| Maximum | 44.5% | 14.3% |
| Range | 42.5% | 13.3% |
| Mean | 14.9% | 5.9% |
| Median | 14.4% | 5.2% |
| Interquartile 25% (IQ1) | 8.4% | 3.9% |
| Interquartile 75% (IQ3) | 19.4% | 8.4% |
| Interquartile Range (IQR) | 11.0% | 4.5% |
| Standard Deviation (Sample) | 8.6% | 3.1% |
| Standard Deviation (Population) | 8.5% | 3.1% |
Similar Demographics by Master's Degree
Demographics Similar to Immigrants from Canada by Master's Degree
In terms of master's degree, the demographic groups most similar to Immigrants from Canada are Bhutanese (17.2%, a difference of 0.070%), Immigrants from Egypt (17.2%, a difference of 0.090%), Romanian (17.2%, a difference of 0.16%), Immigrants from North America (17.2%, a difference of 0.21%), and Immigrants from Italy (17.2%, a difference of 0.27%).
| Demographics | Rating | Rank | Master's Degree |
| Immigrants | Western Asia | 99.5 /100 | #81 | Exceptional 17.5% |
| Greeks | 99.5 /100 | #82 | Exceptional 17.5% |
| Immigrants | Zimbabwe | 99.5 /100 | #83 | Exceptional 17.4% |
| Immigrants | Scotland | 99.4 /100 | #84 | Exceptional 17.4% |
| Immigrants | Brazil | 99.4 /100 | #85 | Exceptional 17.4% |
| Immigrants | Croatia | 99.3 /100 | #86 | Exceptional 17.3% |
| Maltese | 99.3 /100 | #87 | Exceptional 17.3% |
| Immigrants | Canada | 99.2 /100 | #88 | Exceptional 17.2% |
| Bhutanese | 99.1 /100 | #89 | Exceptional 17.2% |
| Immigrants | Egypt | 99.1 /100 | #90 | Exceptional 17.2% |
| Romanians | 99.1 /100 | #91 | Exceptional 17.2% |
| Immigrants | North America | 99.1 /100 | #92 | Exceptional 17.2% |
| Immigrants | Italy | 99.1 /100 | #93 | Exceptional 17.2% |
| Ugandans | 99.0 /100 | #94 | Exceptional 17.1% |
| Immigrants | Morocco | 98.9 /100 | #95 | Exceptional 17.1% |
Demographics Similar to Creek by Master's Degree
In terms of master's degree, the demographic groups most similar to Creek are Inupiat (10.5%, a difference of 0.0%), Paiute (10.5%, a difference of 0.18%), Bangladeshi (10.5%, a difference of 0.32%), Nepalese (10.5%, a difference of 0.40%), and Dutch West Indian (10.6%, a difference of 1.1%).
| Demographics | Rating | Rank | Master's Degree |
| Kiowa | 0.0 /100 | #319 | Tragic 10.8% |
| Immigrants | Micronesia | 0.0 /100 | #320 | Tragic 10.8% |
| Pennsylvania Germans | 0.0 /100 | #321 | Tragic 10.7% |
| Sioux | 0.0 /100 | #322 | Tragic 10.7% |
| Crow | 0.0 /100 | #323 | Tragic 10.6% |
| Dutch West Indians | 0.0 /100 | #324 | Tragic 10.6% |
| Inupiat | 0.0 /100 | #325 | Tragic 10.5% |
| Creek | 0.0 /100 | #326 | Tragic 10.5% |
| Paiute | 0.0 /100 | #327 | Tragic 10.5% |
| Bangladeshis | 0.0 /100 | #328 | Tragic 10.5% |
| Nepalese | 0.0 /100 | #329 | Tragic 10.5% |
| Fijians | 0.0 /100 | #330 | Tragic 10.3% |
| Pueblo | 0.0 /100 | #331 | Tragic 10.3% |
| Immigrants | Azores | 0.0 /100 | #332 | Tragic 10.2% |
| Menominee | 0.0 /100 | #333 | Tragic 10.2% |