Scotch-Irish vs Creek Master's Degree
COMPARE
Scotch-Irish
Creek
Master's Degree
Master's Degree Comparison
Scotch-Irish
Creek
14.4%
MASTER'S DEGREE
25.0/ 100
METRIC RATING
201st/ 347
METRIC RANK
10.5%
MASTER'S DEGREE
0.0/ 100
METRIC RATING
326th/ 347
METRIC RANK
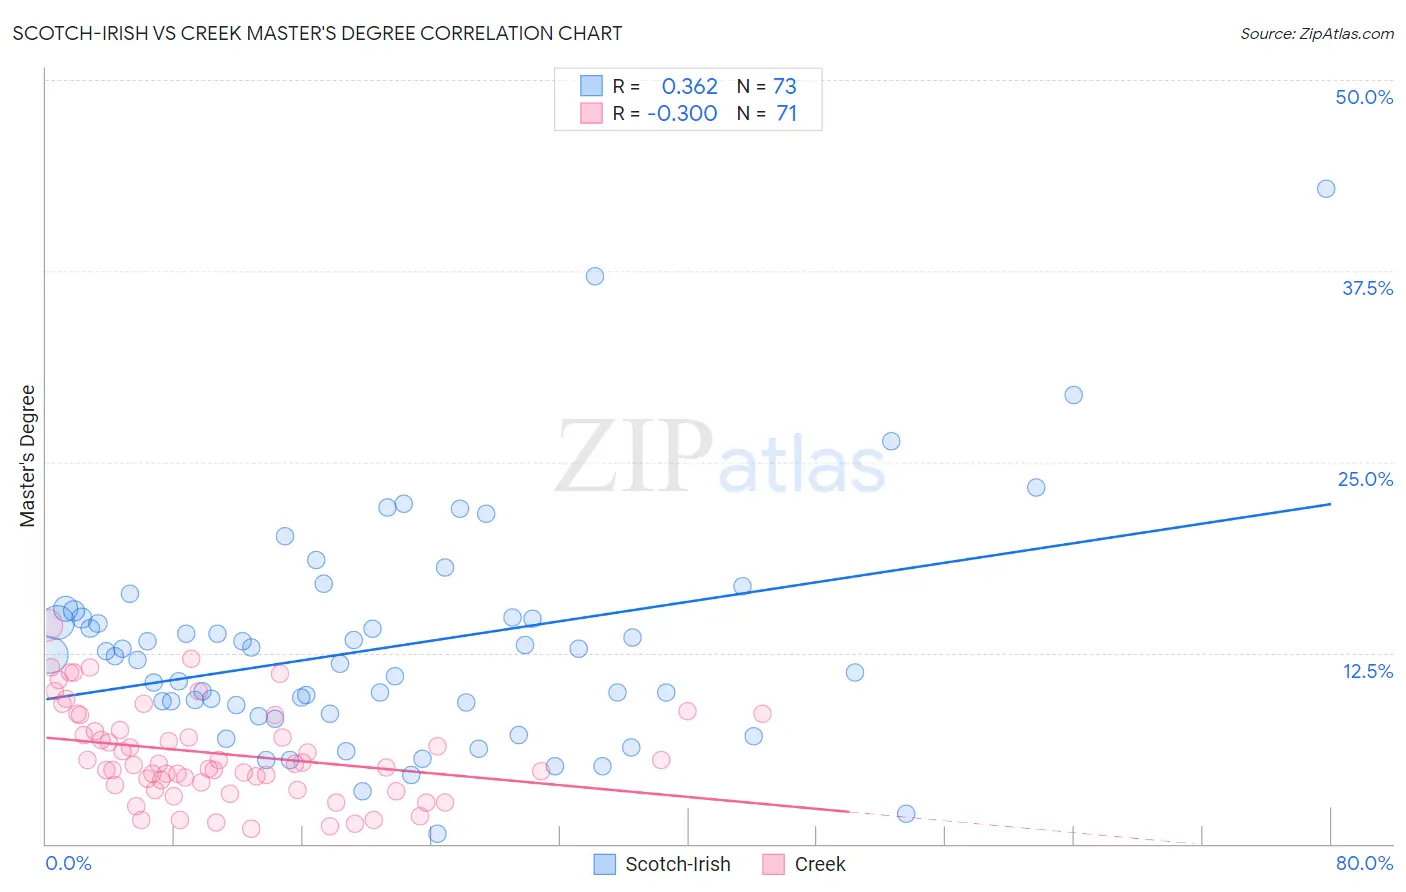
Scotch-Irish vs Creek Master's Degree Correlation Chart
The statistical analysis conducted on geographies consisting of 548,205,332 people shows a mild positive correlation between the proportion of Scotch-Irish and percentage of population with at least master's degree education in the United States with a correlation coefficient (R) of 0.362 and weighted average of 14.4%. Similarly, the statistical analysis conducted on geographies consisting of 178,384,928 people shows a weak negative correlation between the proportion of Creek and percentage of population with at least master's degree education in the United States with a correlation coefficient (R) of -0.300 and weighted average of 10.5%, a difference of 36.9%.
Master's Degree Correlation Summary
| Measurement | Scotch-Irish | Creek |
| Minimum | 0.67% | 0.96% |
| Maximum | 42.9% | 14.3% |
| Range | 42.2% | 13.3% |
| Mean | 12.9% | 5.9% |
| Median | 12.3% | 5.2% |
| Interquartile 25% (IQ1) | 8.8% | 3.9% |
| Interquartile 75% (IQ3) | 14.8% | 8.4% |
| Interquartile Range (IQR) | 6.0% | 4.5% |
| Standard Deviation (Sample) | 7.2% | 3.1% |
| Standard Deviation (Population) | 7.1% | 3.1% |
Similar Demographics by Master's Degree
Demographics Similar to Scotch-Irish by Master's Degree
In terms of master's degree, the demographic groups most similar to Scotch-Irish are Panamanian (14.4%, a difference of 0.010%), Immigrants from Western Africa (14.4%, a difference of 0.010%), Yugoslavian (14.4%, a difference of 0.13%), French (14.4%, a difference of 0.24%), and Trinidadian and Tobagonian (14.4%, a difference of 0.27%).
| Demographics | Rating | Rank | Master's Degree |
| Chinese | 32.5 /100 | #194 | Fair 14.6% |
| Danes | 31.3 /100 | #195 | Fair 14.5% |
| Czechoslovakians | 29.9 /100 | #196 | Fair 14.5% |
| Belgians | 28.0 /100 | #197 | Fair 14.5% |
| West Indians | 27.4 /100 | #198 | Fair 14.5% |
| Immigrants | Armenia | 27.2 /100 | #199 | Fair 14.5% |
| Panamanians | 25.1 /100 | #200 | Fair 14.4% |
| Scotch-Irish | 25.0 /100 | #201 | Fair 14.4% |
| Immigrants | Western Africa | 24.9 /100 | #202 | Fair 14.4% |
| Yugoslavians | 24.3 /100 | #203 | Fair 14.4% |
| French | 23.7 /100 | #204 | Fair 14.4% |
| Trinidadians and Tobagonians | 23.5 /100 | #205 | Fair 14.4% |
| Scandinavians | 23.3 /100 | #206 | Fair 14.4% |
| Immigrants | Bosnia and Herzegovina | 22.0 /100 | #207 | Fair 14.3% |
| Immigrants | Barbados | 20.5 /100 | #208 | Fair 14.3% |
Demographics Similar to Creek by Master's Degree
In terms of master's degree, the demographic groups most similar to Creek are Inupiat (10.5%, a difference of 0.0%), Paiute (10.5%, a difference of 0.18%), Bangladeshi (10.5%, a difference of 0.32%), Nepalese (10.5%, a difference of 0.40%), and Dutch West Indian (10.6%, a difference of 1.1%).
| Demographics | Rating | Rank | Master's Degree |
| Kiowa | 0.0 /100 | #319 | Tragic 10.8% |
| Immigrants | Micronesia | 0.0 /100 | #320 | Tragic 10.8% |
| Pennsylvania Germans | 0.0 /100 | #321 | Tragic 10.7% |
| Sioux | 0.0 /100 | #322 | Tragic 10.7% |
| Crow | 0.0 /100 | #323 | Tragic 10.6% |
| Dutch West Indians | 0.0 /100 | #324 | Tragic 10.6% |
| Inupiat | 0.0 /100 | #325 | Tragic 10.5% |
| Creek | 0.0 /100 | #326 | Tragic 10.5% |
| Paiute | 0.0 /100 | #327 | Tragic 10.5% |
| Bangladeshis | 0.0 /100 | #328 | Tragic 10.5% |
| Nepalese | 0.0 /100 | #329 | Tragic 10.5% |
| Fijians | 0.0 /100 | #330 | Tragic 10.3% |
| Pueblo | 0.0 /100 | #331 | Tragic 10.3% |
| Immigrants | Azores | 0.0 /100 | #332 | Tragic 10.2% |
| Menominee | 0.0 /100 | #333 | Tragic 10.2% |