Immigrants from Armenia vs Immigrants from Sudan 9th Grade
COMPARE
Immigrants from Armenia
Immigrants from Sudan
9th Grade
9th Grade Comparison
Immigrants from Armenia
Immigrants from Sudan
91.4%
9TH GRADE
0.0/ 100
METRIC RATING
326th/ 347
METRIC RANK
94.6%
9TH GRADE
17.6/ 100
METRIC RATING
205th/ 347
METRIC RANK
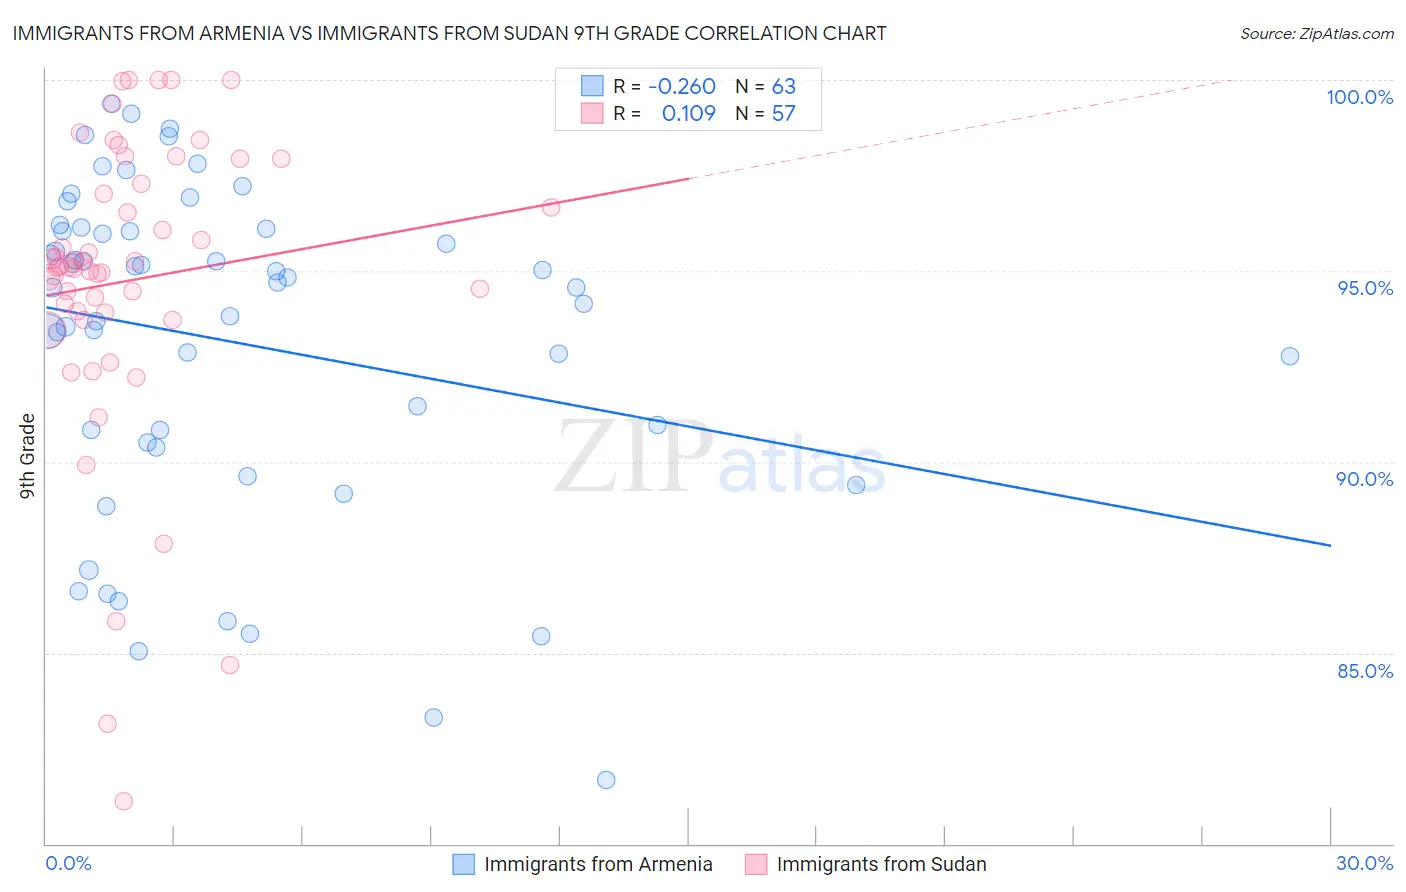
Immigrants from Armenia vs Immigrants from Sudan 9th Grade Correlation Chart
The statistical analysis conducted on geographies consisting of 97,657,339 people shows a weak negative correlation between the proportion of Immigrants from Armenia and percentage of population with at least 9th grade education in the United States with a correlation coefficient (R) of -0.260 and weighted average of 91.4%. Similarly, the statistical analysis conducted on geographies consisting of 118,959,807 people shows a poor positive correlation between the proportion of Immigrants from Sudan and percentage of population with at least 9th grade education in the United States with a correlation coefficient (R) of 0.109 and weighted average of 94.6%, a difference of 3.5%.
9th Grade Correlation Summary
| Measurement | Immigrants from Armenia | Immigrants from Sudan |
| Minimum | 81.7% | 81.1% |
| Maximum | 99.4% | 100.0% |
| Range | 17.7% | 18.9% |
| Mean | 93.1% | 94.8% |
| Median | 94.6% | 95.1% |
| Interquartile 25% (IQ1) | 90.5% | 93.8% |
| Interquartile 75% (IQ3) | 96.0% | 97.6% |
| Interquartile Range (IQR) | 5.5% | 3.8% |
| Standard Deviation (Sample) | 4.3% | 4.0% |
| Standard Deviation (Population) | 4.2% | 4.0% |
Similar Demographics by 9th Grade
Demographics Similar to Immigrants from Armenia by 9th Grade
In terms of 9th grade, the demographic groups most similar to Immigrants from Armenia are Immigrants from Nicaragua (91.3%, a difference of 0.050%), Central American Indian (91.5%, a difference of 0.10%), Dominican (91.1%, a difference of 0.34%), Honduran (91.0%, a difference of 0.37%), and Immigrants from Belize (91.8%, a difference of 0.43%).
| Demographics | Rating | Rank | 9th Grade |
| Ecuadorians | 0.0 /100 | #319 | Tragic 91.9% |
| Nicaraguans | 0.0 /100 | #320 | Tragic 91.9% |
| Immigrants | Ecuador | 0.0 /100 | #321 | Tragic 91.8% |
| Belizeans | 0.0 /100 | #322 | Tragic 91.8% |
| Puerto Ricans | 0.0 /100 | #323 | Tragic 91.8% |
| Immigrants | Belize | 0.0 /100 | #324 | Tragic 91.8% |
| Central American Indians | 0.0 /100 | #325 | Tragic 91.5% |
| Immigrants | Armenia | 0.0 /100 | #326 | Tragic 91.4% |
| Immigrants | Nicaragua | 0.0 /100 | #327 | Tragic 91.3% |
| Dominicans | 0.0 /100 | #328 | Tragic 91.1% |
| Hondurans | 0.0 /100 | #329 | Tragic 91.0% |
| Immigrants | Cabo Verde | 0.0 /100 | #330 | Tragic 90.9% |
| Mexican American Indians | 0.0 /100 | #331 | Tragic 90.9% |
| Hispanics or Latinos | 0.0 /100 | #332 | Tragic 90.9% |
| Immigrants | Yemen | 0.0 /100 | #333 | Tragic 90.8% |
Demographics Similar to Immigrants from Sudan by 9th Grade
In terms of 9th grade, the demographic groups most similar to Immigrants from Sudan are Samoan (94.6%, a difference of 0.0%), Moroccan (94.6%, a difference of 0.020%), Immigrants from Morocco (94.6%, a difference of 0.020%), Immigrants from Zaire (94.6%, a difference of 0.030%), and Black/African American (94.6%, a difference of 0.030%).
| Demographics | Rating | Rank | 9th Grade |
| Hawaiians | 22.7 /100 | #198 | Fair 94.7% |
| Laotians | 21.0 /100 | #199 | Fair 94.6% |
| Immigrants | Zaire | 20.6 /100 | #200 | Fair 94.6% |
| Blacks/African Americans | 20.5 /100 | #201 | Fair 94.6% |
| Immigrants | Eastern Asia | 19.8 /100 | #202 | Poor 94.6% |
| Immigrants | Bahamas | 19.8 /100 | #203 | Poor 94.6% |
| Moroccans | 19.6 /100 | #204 | Poor 94.6% |
| Immigrants | Sudan | 17.6 /100 | #205 | Poor 94.6% |
| Samoans | 17.3 /100 | #206 | Poor 94.6% |
| Immigrants | Morocco | 16.3 /100 | #207 | Poor 94.6% |
| Immigrants | Pakistan | 15.5 /100 | #208 | Poor 94.6% |
| Comanche | 14.9 /100 | #209 | Poor 94.6% |
| Immigrants | Chile | 13.4 /100 | #210 | Poor 94.5% |
| Immigrants | Indonesia | 12.3 /100 | #211 | Poor 94.5% |
| Immigrants | Malaysia | 12.2 /100 | #212 | Poor 94.5% |