Canadian vs Immigrants from Sudan 9th Grade
COMPARE
Canadian
Immigrants from Sudan
9th Grade
9th Grade Comparison
Canadians
Immigrants from Sudan
95.9%
9TH GRADE
99.7/ 100
METRIC RATING
63rd/ 347
METRIC RANK
94.6%
9TH GRADE
17.6/ 100
METRIC RATING
205th/ 347
METRIC RANK
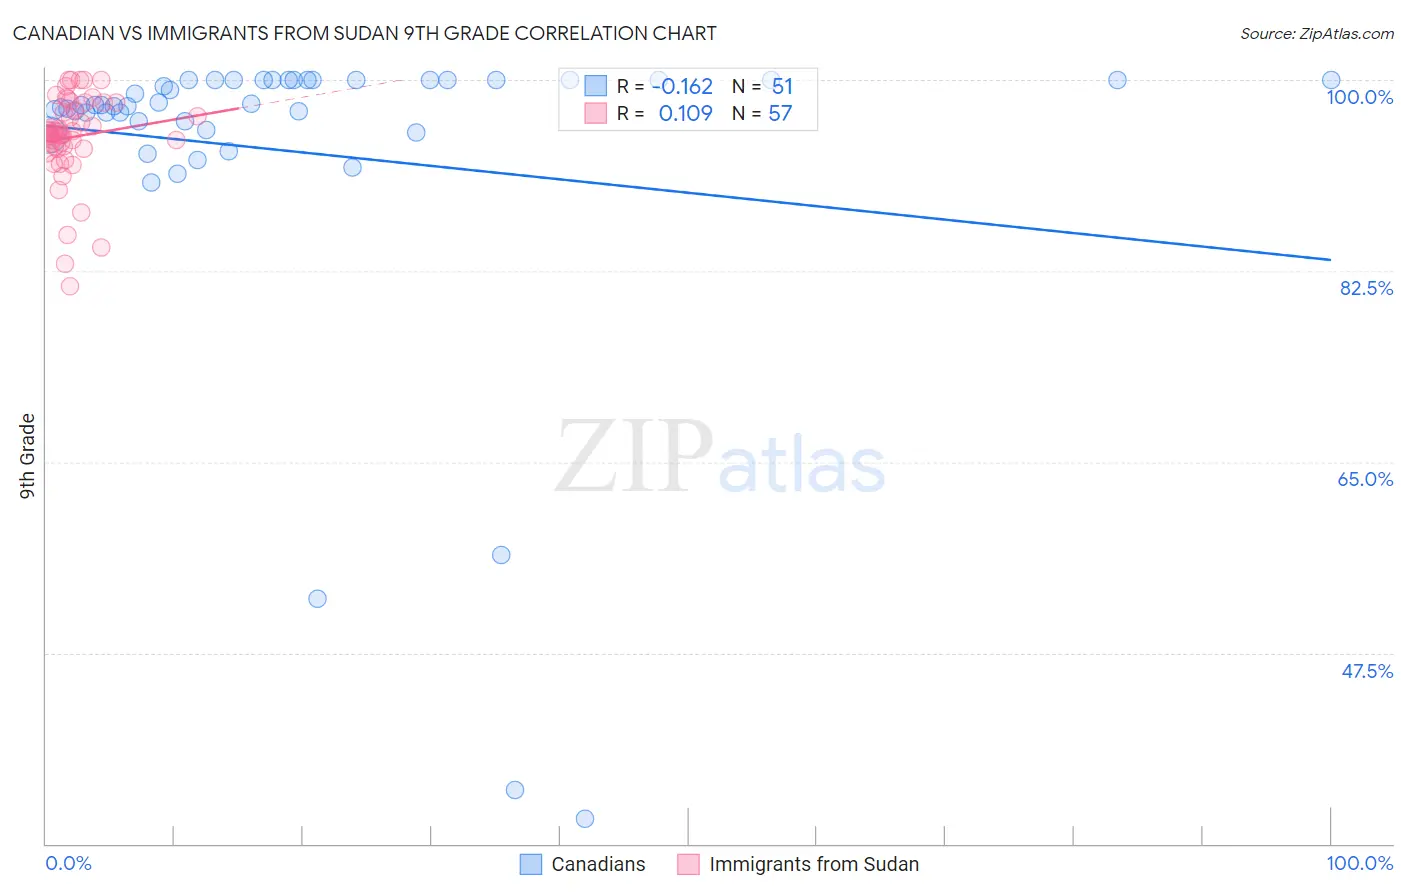
Canadian vs Immigrants from Sudan 9th Grade Correlation Chart
The statistical analysis conducted on geographies consisting of 437,556,705 people shows a poor negative correlation between the proportion of Canadians and percentage of population with at least 9th grade education in the United States with a correlation coefficient (R) of -0.162 and weighted average of 95.9%. Similarly, the statistical analysis conducted on geographies consisting of 118,959,807 people shows a poor positive correlation between the proportion of Immigrants from Sudan and percentage of population with at least 9th grade education in the United States with a correlation coefficient (R) of 0.109 and weighted average of 94.6%, a difference of 1.3%.
9th Grade Correlation Summary
| Measurement | Canadian | Immigrants from Sudan |
| Minimum | 32.3% | 81.1% |
| Maximum | 100.0% | 100.0% |
| Range | 67.7% | 18.9% |
| Mean | 93.4% | 94.8% |
| Median | 97.7% | 95.1% |
| Interquartile 25% (IQ1) | 95.4% | 93.8% |
| Interquartile 75% (IQ3) | 100.0% | 97.6% |
| Interquartile Range (IQR) | 4.6% | 3.8% |
| Standard Deviation (Sample) | 15.1% | 4.0% |
| Standard Deviation (Population) | 14.9% | 4.0% |
Similar Demographics by 9th Grade
Demographics Similar to Canadians by 9th Grade
In terms of 9th grade, the demographic groups most similar to Canadians are Zimbabwean (95.9%, a difference of 0.010%), Immigrants from England (95.9%, a difference of 0.020%), Ukrainian (95.9%, a difference of 0.040%), Immigrants from Netherlands (95.8%, a difference of 0.040%), and Cypriot (95.8%, a difference of 0.040%).
| Demographics | Rating | Rank | 9th Grade |
| Immigrants | North America | 99.8 /100 | #56 | Exceptional 96.0% |
| Macedonians | 99.8 /100 | #57 | Exceptional 96.0% |
| Aleuts | 99.8 /100 | #58 | Exceptional 96.0% |
| New Zealanders | 99.8 /100 | #59 | Exceptional 95.9% |
| Native Hawaiians | 99.8 /100 | #60 | Exceptional 95.9% |
| Sioux | 99.8 /100 | #61 | Exceptional 95.9% |
| Ukrainians | 99.7 /100 | #62 | Exceptional 95.9% |
| Canadians | 99.7 /100 | #63 | Exceptional 95.9% |
| Zimbabweans | 99.7 /100 | #64 | Exceptional 95.9% |
| Immigrants | England | 99.6 /100 | #65 | Exceptional 95.9% |
| Immigrants | Netherlands | 99.6 /100 | #66 | Exceptional 95.8% |
| Cypriots | 99.6 /100 | #67 | Exceptional 95.8% |
| Immigrants | Ireland | 99.6 /100 | #68 | Exceptional 95.8% |
| Immigrants | Lithuania | 99.6 /100 | #69 | Exceptional 95.8% |
| Immigrants | Australia | 99.5 /100 | #70 | Exceptional 95.8% |
Demographics Similar to Immigrants from Sudan by 9th Grade
In terms of 9th grade, the demographic groups most similar to Immigrants from Sudan are Samoan (94.6%, a difference of 0.0%), Moroccan (94.6%, a difference of 0.020%), Immigrants from Morocco (94.6%, a difference of 0.020%), Immigrants from Zaire (94.6%, a difference of 0.030%), and Black/African American (94.6%, a difference of 0.030%).
| Demographics | Rating | Rank | 9th Grade |
| Hawaiians | 22.7 /100 | #198 | Fair 94.7% |
| Laotians | 21.0 /100 | #199 | Fair 94.6% |
| Immigrants | Zaire | 20.6 /100 | #200 | Fair 94.6% |
| Blacks/African Americans | 20.5 /100 | #201 | Fair 94.6% |
| Immigrants | Eastern Asia | 19.8 /100 | #202 | Poor 94.6% |
| Immigrants | Bahamas | 19.8 /100 | #203 | Poor 94.6% |
| Moroccans | 19.6 /100 | #204 | Poor 94.6% |
| Immigrants | Sudan | 17.6 /100 | #205 | Poor 94.6% |
| Samoans | 17.3 /100 | #206 | Poor 94.6% |
| Immigrants | Morocco | 16.3 /100 | #207 | Poor 94.6% |
| Immigrants | Pakistan | 15.5 /100 | #208 | Poor 94.6% |
| Comanche | 14.9 /100 | #209 | Poor 94.6% |
| Immigrants | Chile | 13.4 /100 | #210 | Poor 94.5% |
| Immigrants | Indonesia | 12.3 /100 | #211 | Poor 94.5% |
| Immigrants | Malaysia | 12.2 /100 | #212 | Poor 94.5% |