Palestinian vs Immigrants from Sudan 9th Grade
COMPARE
Palestinian
Immigrants from Sudan
9th Grade
9th Grade Comparison
Palestinians
Immigrants from Sudan
95.4%
9TH GRADE
94.3/ 100
METRIC RATING
127th/ 347
METRIC RANK
94.6%
9TH GRADE
17.6/ 100
METRIC RATING
205th/ 347
METRIC RANK
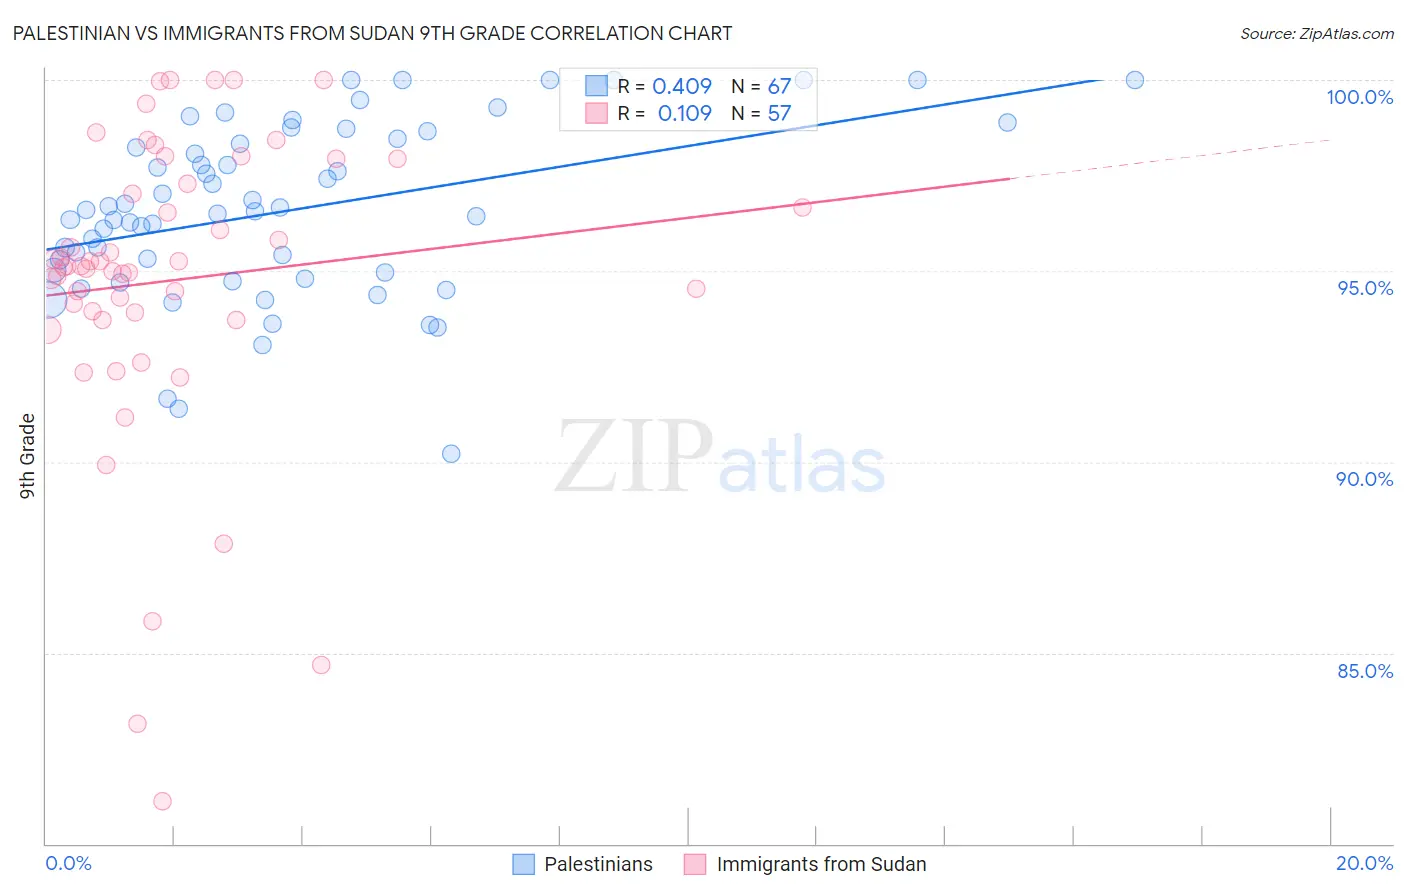
Palestinian vs Immigrants from Sudan 9th Grade Correlation Chart
The statistical analysis conducted on geographies consisting of 216,424,519 people shows a moderate positive correlation between the proportion of Palestinians and percentage of population with at least 9th grade education in the United States with a correlation coefficient (R) of 0.409 and weighted average of 95.4%. Similarly, the statistical analysis conducted on geographies consisting of 118,959,807 people shows a poor positive correlation between the proportion of Immigrants from Sudan and percentage of population with at least 9th grade education in the United States with a correlation coefficient (R) of 0.109 and weighted average of 94.6%, a difference of 0.80%.
9th Grade Correlation Summary
| Measurement | Palestinian | Immigrants from Sudan |
| Minimum | 90.2% | 81.1% |
| Maximum | 100.0% | 100.0% |
| Range | 9.8% | 18.9% |
| Mean | 96.6% | 94.8% |
| Median | 96.6% | 95.1% |
| Interquartile 25% (IQ1) | 94.9% | 93.8% |
| Interquartile 75% (IQ3) | 98.5% | 97.6% |
| Interquartile Range (IQR) | 3.5% | 3.8% |
| Standard Deviation (Sample) | 2.3% | 4.0% |
| Standard Deviation (Population) | 2.3% | 4.0% |
Similar Demographics by 9th Grade
Demographics Similar to Palestinians by 9th Grade
In terms of 9th grade, the demographic groups most similar to Palestinians are Immigrants from Serbia (95.4%, a difference of 0.0%), Immigrants from Hungary (95.4%, a difference of 0.0%), Basque (95.4%, a difference of 0.010%), Jordanian (95.3%, a difference of 0.020%), and Immigrants from South Central Asia (95.4%, a difference of 0.030%).
| Demographics | Rating | Rank | 9th Grade |
| Cambodians | 95.6 /100 | #120 | Exceptional 95.4% |
| Cree | 95.5 /100 | #121 | Exceptional 95.4% |
| Immigrants | Kuwait | 95.5 /100 | #122 | Exceptional 95.4% |
| Kiowa | 95.3 /100 | #123 | Exceptional 95.4% |
| Shoshone | 95.3 /100 | #124 | Exceptional 95.4% |
| Immigrants | South Central Asia | 95.1 /100 | #125 | Exceptional 95.4% |
| Immigrants | Serbia | 94.4 /100 | #126 | Exceptional 95.4% |
| Palestinians | 94.3 /100 | #127 | Exceptional 95.4% |
| Immigrants | Hungary | 94.2 /100 | #128 | Exceptional 95.4% |
| Basques | 94.1 /100 | #129 | Exceptional 95.4% |
| Jordanians | 93.5 /100 | #130 | Exceptional 95.3% |
| Immigrants | North Macedonia | 92.3 /100 | #131 | Exceptional 95.3% |
| Immigrants | Nonimmigrants | 92.0 /100 | #132 | Exceptional 95.3% |
| Israelis | 90.4 /100 | #133 | Exceptional 95.3% |
| Immigrants | Israel | 89.6 /100 | #134 | Excellent 95.3% |
Demographics Similar to Immigrants from Sudan by 9th Grade
In terms of 9th grade, the demographic groups most similar to Immigrants from Sudan are Samoan (94.6%, a difference of 0.0%), Moroccan (94.6%, a difference of 0.020%), Immigrants from Morocco (94.6%, a difference of 0.020%), Immigrants from Zaire (94.6%, a difference of 0.030%), and Black/African American (94.6%, a difference of 0.030%).
| Demographics | Rating | Rank | 9th Grade |
| Hawaiians | 22.7 /100 | #198 | Fair 94.7% |
| Laotians | 21.0 /100 | #199 | Fair 94.6% |
| Immigrants | Zaire | 20.6 /100 | #200 | Fair 94.6% |
| Blacks/African Americans | 20.5 /100 | #201 | Fair 94.6% |
| Immigrants | Eastern Asia | 19.8 /100 | #202 | Poor 94.6% |
| Immigrants | Bahamas | 19.8 /100 | #203 | Poor 94.6% |
| Moroccans | 19.6 /100 | #204 | Poor 94.6% |
| Immigrants | Sudan | 17.6 /100 | #205 | Poor 94.6% |
| Samoans | 17.3 /100 | #206 | Poor 94.6% |
| Immigrants | Morocco | 16.3 /100 | #207 | Poor 94.6% |
| Immigrants | Pakistan | 15.5 /100 | #208 | Poor 94.6% |
| Comanche | 14.9 /100 | #209 | Poor 94.6% |
| Immigrants | Chile | 13.4 /100 | #210 | Poor 94.5% |
| Immigrants | Indonesia | 12.3 /100 | #211 | Poor 94.5% |
| Immigrants | Malaysia | 12.2 /100 | #212 | Poor 94.5% |