Hungarian vs Immigrants from Sierra Leone GED/Equivalency
COMPARE
Hungarian
Immigrants from Sierra Leone
GED/Equivalency
GED/Equivalency Comparison
Hungarians
Immigrants from Sierra Leone
87.4%
GED/EQUIVALENCY
97.9/ 100
METRIC RATING
89th/ 347
METRIC RANK
85.4%
GED/EQUIVALENCY
29.0/ 100
METRIC RATING
188th/ 347
METRIC RANK
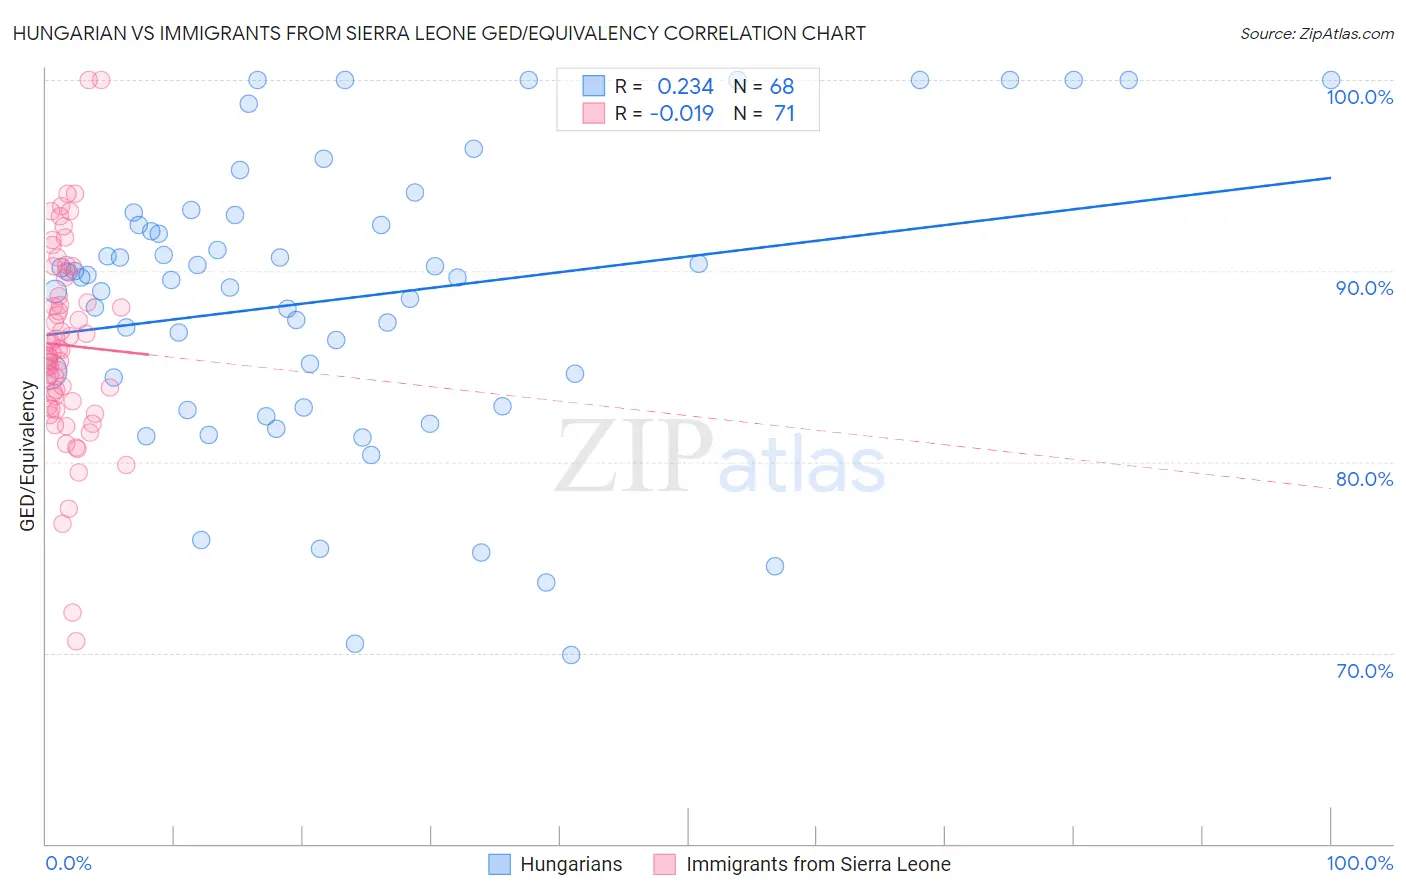
Hungarian vs Immigrants from Sierra Leone GED/Equivalency Correlation Chart
The statistical analysis conducted on geographies consisting of 486,240,766 people shows a weak positive correlation between the proportion of Hungarians and percentage of population with at least ged/equivalency education in the United States with a correlation coefficient (R) of 0.234 and weighted average of 87.4%. Similarly, the statistical analysis conducted on geographies consisting of 101,654,421 people shows no correlation between the proportion of Immigrants from Sierra Leone and percentage of population with at least ged/equivalency education in the United States with a correlation coefficient (R) of -0.019 and weighted average of 85.4%, a difference of 2.5%.
GED/Equivalency Correlation Summary
| Measurement | Hungarian | Immigrants from Sierra Leone |
| Minimum | 69.9% | 70.6% |
| Maximum | 100.0% | 100.0% |
| Range | 30.1% | 29.4% |
| Mean | 88.6% | 86.1% |
| Median | 89.6% | 85.7% |
| Interquartile 25% (IQ1) | 83.7% | 82.9% |
| Interquartile 75% (IQ3) | 92.7% | 89.6% |
| Interquartile Range (IQR) | 9.0% | 6.7% |
| Standard Deviation (Sample) | 7.5% | 5.2% |
| Standard Deviation (Population) | 7.4% | 5.2% |
Similar Demographics by GED/Equivalency
Demographics Similar to Hungarians by GED/Equivalency
In terms of ged/equivalency, the demographic groups most similar to Hungarians are Welsh (87.4%, a difference of 0.0%), Immigrants from Eastern Asia (87.4%, a difference of 0.010%), Israeli (87.4%, a difference of 0.020%), Immigrants from North Macedonia (87.4%, a difference of 0.030%), and Immigrants from Russia (87.4%, a difference of 0.030%).
| Demographics | Rating | Rank | GED/Equivalency |
| Romanians | 98.3 /100 | #82 | Exceptional 87.5% |
| South Africans | 98.3 /100 | #83 | Exceptional 87.5% |
| Immigrants | Romania | 98.1 /100 | #84 | Exceptional 87.5% |
| Dutch | 98.1 /100 | #85 | Exceptional 87.5% |
| Immigrants | Europe | 98.1 /100 | #86 | Exceptional 87.5% |
| Native Hawaiians | 98.1 /100 | #87 | Exceptional 87.5% |
| Immigrants | Norway | 98.1 /100 | #88 | Exceptional 87.5% |
| Hungarians | 97.9 /100 | #89 | Exceptional 87.4% |
| Welsh | 97.9 /100 | #90 | Exceptional 87.4% |
| Immigrants | Eastern Asia | 97.9 /100 | #91 | Exceptional 87.4% |
| Israelis | 97.8 /100 | #92 | Exceptional 87.4% |
| Immigrants | North Macedonia | 97.8 /100 | #93 | Exceptional 87.4% |
| Immigrants | Russia | 97.8 /100 | #94 | Exceptional 87.4% |
| Immigrants | Greece | 97.7 /100 | #95 | Exceptional 87.4% |
| Czechoslovakians | 97.6 /100 | #96 | Exceptional 87.4% |
Demographics Similar to Immigrants from Sierra Leone by GED/Equivalency
In terms of ged/equivalency, the demographic groups most similar to Immigrants from Sierra Leone are Guamanian/Chamorro (85.3%, a difference of 0.010%), Immigrants from Afghanistan (85.4%, a difference of 0.020%), Alaskan Athabascan (85.3%, a difference of 0.040%), Spaniard (85.4%, a difference of 0.070%), and Spanish (85.4%, a difference of 0.090%).
| Demographics | Rating | Rank | GED/Equivalency |
| Moroccans | 37.7 /100 | #181 | Fair 85.5% |
| Sudanese | 35.2 /100 | #182 | Fair 85.5% |
| Immigrants | Sudan | 34.2 /100 | #183 | Fair 85.5% |
| Immigrants | Oceania | 33.6 /100 | #184 | Fair 85.5% |
| Spanish | 32.8 /100 | #185 | Fair 85.4% |
| Spaniards | 31.9 /100 | #186 | Fair 85.4% |
| Immigrants | Afghanistan | 29.8 /100 | #187 | Fair 85.4% |
| Immigrants | Sierra Leone | 29.0 /100 | #188 | Fair 85.4% |
| Guamanians/Chamorros | 28.4 /100 | #189 | Fair 85.3% |
| Alaskan Athabascans | 27.5 /100 | #190 | Fair 85.3% |
| South American Indians | 22.8 /100 | #191 | Fair 85.2% |
| Immigrants | Nonimmigrants | 22.7 /100 | #192 | Fair 85.2% |
| Delaware | 22.2 /100 | #193 | Fair 85.2% |
| Puget Sound Salish | 20.8 /100 | #194 | Fair 85.2% |
| Chippewa | 20.8 /100 | #195 | Fair 85.2% |