Yup'ik vs Immigrants from Sierra Leone GED/Equivalency
COMPARE
Yup'ik
Immigrants from Sierra Leone
GED/Equivalency
GED/Equivalency Comparison
Yup'ik
Immigrants from Sierra Leone
80.0%
GED/EQUIVALENCY
0.0/ 100
METRIC RATING
321st/ 347
METRIC RANK
85.4%
GED/EQUIVALENCY
29.0/ 100
METRIC RATING
188th/ 347
METRIC RANK
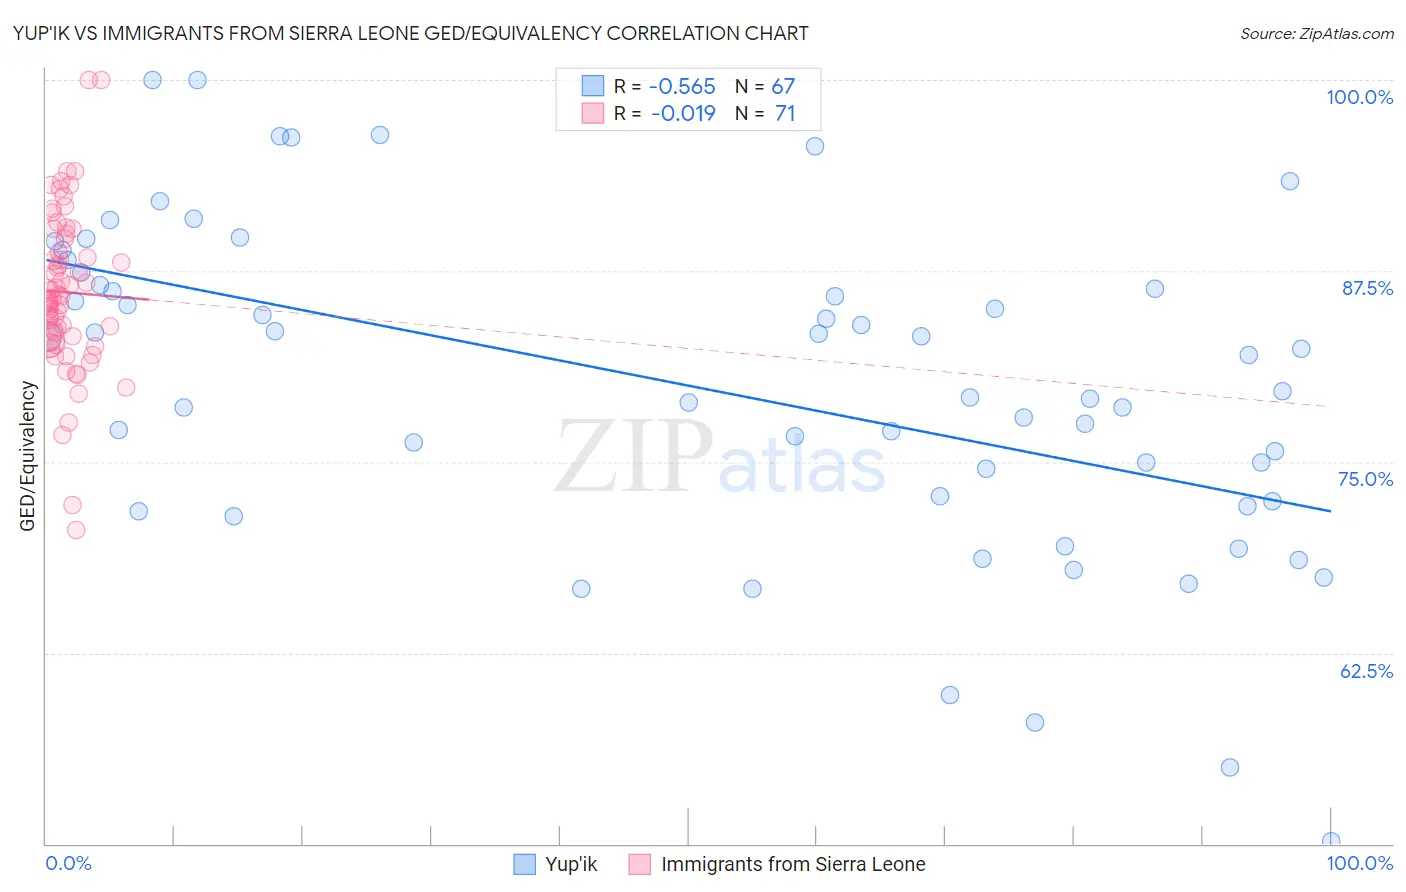
Yup'ik vs Immigrants from Sierra Leone GED/Equivalency Correlation Chart
The statistical analysis conducted on geographies consisting of 39,962,947 people shows a substantial negative correlation between the proportion of Yup'ik and percentage of population with at least ged/equivalency education in the United States with a correlation coefficient (R) of -0.565 and weighted average of 80.0%. Similarly, the statistical analysis conducted on geographies consisting of 101,654,421 people shows no correlation between the proportion of Immigrants from Sierra Leone and percentage of population with at least ged/equivalency education in the United States with a correlation coefficient (R) of -0.019 and weighted average of 85.4%, a difference of 6.7%.
GED/Equivalency Correlation Summary
| Measurement | Yup'ik | Immigrants from Sierra Leone |
| Minimum | 50.2% | 70.6% |
| Maximum | 100.0% | 100.0% |
| Range | 49.8% | 29.4% |
| Mean | 79.9% | 86.1% |
| Median | 79.6% | 85.7% |
| Interquartile 25% (IQ1) | 72.4% | 82.9% |
| Interquartile 75% (IQ3) | 86.6% | 89.6% |
| Interquartile Range (IQR) | 14.2% | 6.7% |
| Standard Deviation (Sample) | 10.6% | 5.2% |
| Standard Deviation (Population) | 10.5% | 5.2% |
Similar Demographics by GED/Equivalency
Demographics Similar to Yup'ik by GED/Equivalency
In terms of ged/equivalency, the demographic groups most similar to Yup'ik are Lumbee (80.0%, a difference of 0.070%), Immigrants from Cuba (80.2%, a difference of 0.17%), Immigrants from Nicaragua (79.9%, a difference of 0.19%), Yaqui (80.5%, a difference of 0.58%), and Immigrants from Belize (80.5%, a difference of 0.58%).
| Demographics | Rating | Rank | GED/Equivalency |
| Belizeans | 0.0 /100 | #314 | Tragic 80.9% |
| Apache | 0.0 /100 | #315 | Tragic 80.7% |
| Central American Indians | 0.0 /100 | #316 | Tragic 80.6% |
| Immigrants | Caribbean | 0.0 /100 | #317 | Tragic 80.5% |
| Yaqui | 0.0 /100 | #318 | Tragic 80.5% |
| Immigrants | Belize | 0.0 /100 | #319 | Tragic 80.5% |
| Immigrants | Cuba | 0.0 /100 | #320 | Tragic 80.2% |
| Yup'ik | 0.0 /100 | #321 | Tragic 80.0% |
| Lumbee | 0.0 /100 | #322 | Tragic 80.0% |
| Immigrants | Nicaragua | 0.0 /100 | #323 | Tragic 79.9% |
| Mexican American Indians | 0.0 /100 | #324 | Tragic 79.4% |
| Hondurans | 0.0 /100 | #325 | Tragic 79.3% |
| Yuman | 0.0 /100 | #326 | Tragic 79.2% |
| Central Americans | 0.0 /100 | #327 | Tragic 79.2% |
| Hispanics or Latinos | 0.0 /100 | #328 | Tragic 79.1% |
Demographics Similar to Immigrants from Sierra Leone by GED/Equivalency
In terms of ged/equivalency, the demographic groups most similar to Immigrants from Sierra Leone are Guamanian/Chamorro (85.3%, a difference of 0.010%), Immigrants from Afghanistan (85.4%, a difference of 0.020%), Alaskan Athabascan (85.3%, a difference of 0.040%), Spaniard (85.4%, a difference of 0.070%), and Spanish (85.4%, a difference of 0.090%).
| Demographics | Rating | Rank | GED/Equivalency |
| Moroccans | 37.7 /100 | #181 | Fair 85.5% |
| Sudanese | 35.2 /100 | #182 | Fair 85.5% |
| Immigrants | Sudan | 34.2 /100 | #183 | Fair 85.5% |
| Immigrants | Oceania | 33.6 /100 | #184 | Fair 85.5% |
| Spanish | 32.8 /100 | #185 | Fair 85.4% |
| Spaniards | 31.9 /100 | #186 | Fair 85.4% |
| Immigrants | Afghanistan | 29.8 /100 | #187 | Fair 85.4% |
| Immigrants | Sierra Leone | 29.0 /100 | #188 | Fair 85.4% |
| Guamanians/Chamorros | 28.4 /100 | #189 | Fair 85.3% |
| Alaskan Athabascans | 27.5 /100 | #190 | Fair 85.3% |
| South American Indians | 22.8 /100 | #191 | Fair 85.2% |
| Immigrants | Nonimmigrants | 22.7 /100 | #192 | Fair 85.2% |
| Delaware | 22.2 /100 | #193 | Fair 85.2% |
| Puget Sound Salish | 20.8 /100 | #194 | Fair 85.2% |
| Chippewa | 20.8 /100 | #195 | Fair 85.2% |