Welsh vs Immigrants from Cabo Verde Master's Degree
COMPARE
Welsh
Immigrants from Cabo Verde
Master's Degree
Master's Degree Comparison
Welsh
Immigrants from Cabo Verde
14.6%
MASTER'S DEGREE
34.2/ 100
METRIC RATING
191st/ 347
METRIC RANK
11.3%
MASTER'S DEGREE
0.1/ 100
METRIC RATING
304th/ 347
METRIC RANK
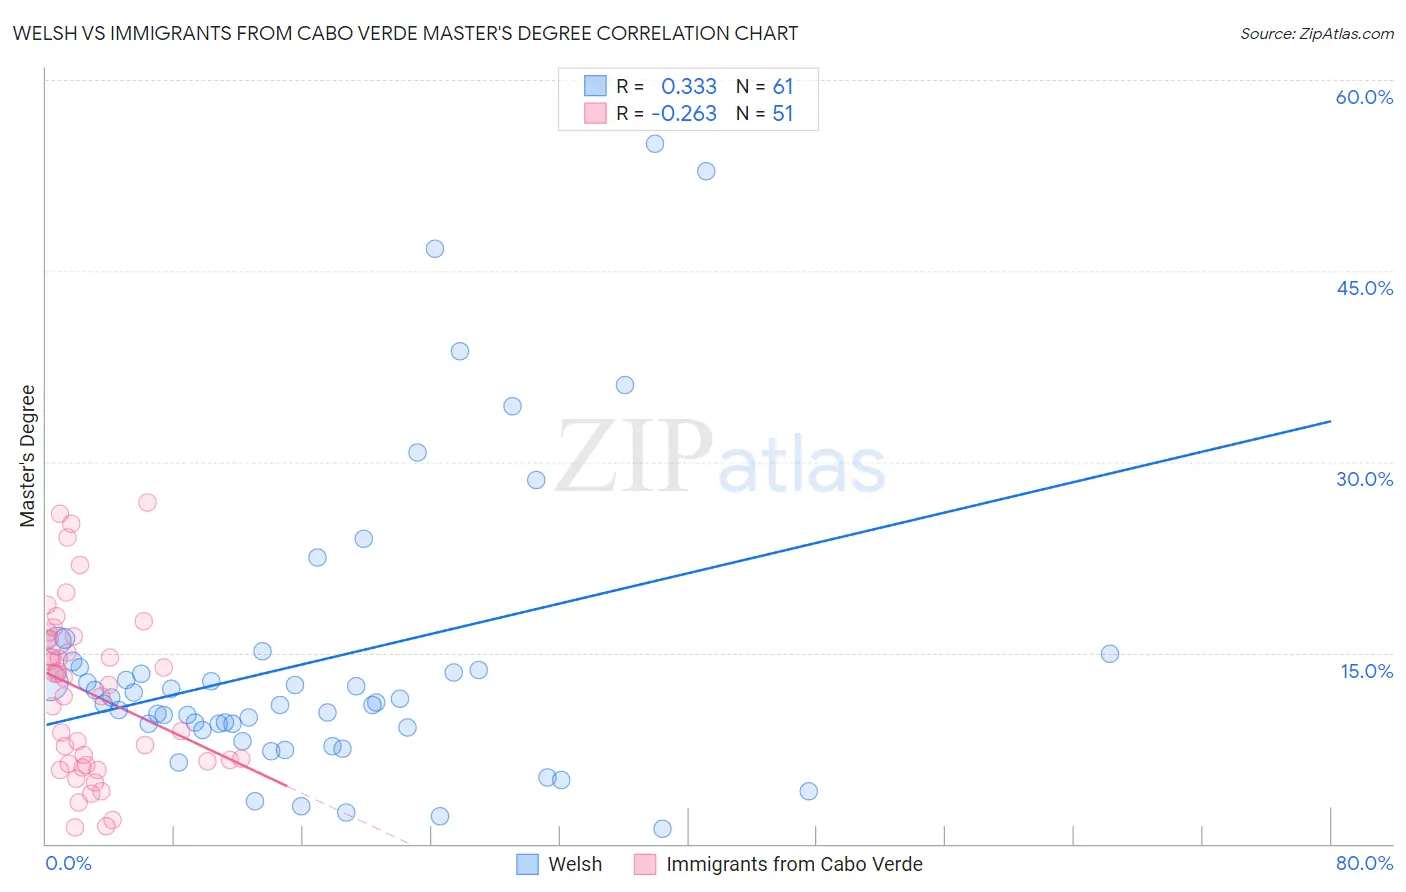
Welsh vs Immigrants from Cabo Verde Master's Degree Correlation Chart
The statistical analysis conducted on geographies consisting of 528,158,256 people shows a mild positive correlation between the proportion of Welsh and percentage of population with at least master's degree education in the United States with a correlation coefficient (R) of 0.333 and weighted average of 14.6%. Similarly, the statistical analysis conducted on geographies consisting of 38,158,316 people shows a weak negative correlation between the proportion of Immigrants from Cabo Verde and percentage of population with at least master's degree education in the United States with a correlation coefficient (R) of -0.263 and weighted average of 11.3%, a difference of 28.8%.
Master's Degree Correlation Summary
| Measurement | Welsh | Immigrants from Cabo Verde |
| Minimum | 1.2% | 1.2% |
| Maximum | 55.0% | 26.8% |
| Range | 53.8% | 25.5% |
| Mean | 14.4% | 11.9% |
| Median | 11.1% | 12.5% |
| Interquartile 25% (IQ1) | 9.0% | 6.3% |
| Interquartile 75% (IQ3) | 14.1% | 16.1% |
| Interquartile Range (IQR) | 5.1% | 9.8% |
| Standard Deviation (Sample) | 11.5% | 6.6% |
| Standard Deviation (Population) | 11.4% | 6.5% |
Similar Demographics by Master's Degree
Demographics Similar to Welsh by Master's Degree
In terms of master's degree, the demographic groups most similar to Welsh are Immigrants from Middle Africa (14.6%, a difference of 0.090%), Immigrants from Nigeria (14.6%, a difference of 0.22%), Spaniard (14.6%, a difference of 0.23%), Immigrants (14.6%, a difference of 0.25%), and Chinese (14.6%, a difference of 0.26%).
| Demographics | Rating | Rank | Master's Degree |
| Immigrants | Zaire | 39.5 /100 | #184 | Fair 14.7% |
| Barbadians | 38.3 /100 | #185 | Fair 14.7% |
| Immigrants | Oceania | 37.1 /100 | #186 | Fair 14.7% |
| Basques | 36.5 /100 | #187 | Fair 14.7% |
| Immigrants | Costa Rica | 36.2 /100 | #188 | Fair 14.7% |
| Immigrants | Immigrants | 36.0 /100 | #189 | Fair 14.6% |
| Spaniards | 35.8 /100 | #190 | Fair 14.6% |
| Welsh | 34.2 /100 | #191 | Fair 14.6% |
| Immigrants | Middle Africa | 33.6 /100 | #192 | Fair 14.6% |
| Immigrants | Nigeria | 32.7 /100 | #193 | Fair 14.6% |
| Chinese | 32.5 /100 | #194 | Fair 14.6% |
| Danes | 31.3 /100 | #195 | Fair 14.5% |
| Czechoslovakians | 29.9 /100 | #196 | Fair 14.5% |
| Belgians | 28.0 /100 | #197 | Fair 14.5% |
| West Indians | 27.4 /100 | #198 | Fair 14.5% |
Demographics Similar to Immigrants from Cabo Verde by Master's Degree
In terms of master's degree, the demographic groups most similar to Immigrants from Cabo Verde are Immigrants from Laos (11.4%, a difference of 0.19%), Cherokee (11.4%, a difference of 0.21%), Tsimshian (11.4%, a difference of 0.52%), Immigrants from Latin America (11.3%, a difference of 0.65%), and Chippewa (11.4%, a difference of 0.68%).
| Demographics | Rating | Rank | Master's Degree |
| Immigrants | Yemen | 0.1 /100 | #297 | Tragic 11.6% |
| Samoans | 0.1 /100 | #298 | Tragic 11.5% |
| Chickasaw | 0.1 /100 | #299 | Tragic 11.4% |
| Chippewa | 0.1 /100 | #300 | Tragic 11.4% |
| Tsimshian | 0.1 /100 | #301 | Tragic 11.4% |
| Cherokee | 0.1 /100 | #302 | Tragic 11.4% |
| Immigrants | Laos | 0.1 /100 | #303 | Tragic 11.4% |
| Immigrants | Cabo Verde | 0.1 /100 | #304 | Tragic 11.3% |
| Immigrants | Latin America | 0.0 /100 | #305 | Tragic 11.3% |
| Mexican American Indians | 0.0 /100 | #306 | Tragic 11.2% |
| Cheyenne | 0.0 /100 | #307 | Tragic 11.2% |
| Puerto Ricans | 0.0 /100 | #308 | Tragic 11.2% |
| Puget Sound Salish | 0.0 /100 | #309 | Tragic 11.1% |
| Shoshone | 0.0 /100 | #310 | Tragic 11.1% |
| Seminole | 0.0 /100 | #311 | Tragic 11.0% |