American vs Immigrants from Cabo Verde Master's Degree
COMPARE
American
Immigrants from Cabo Verde
Master's Degree
Master's Degree Comparison
Americans
Immigrants from Cabo Verde
12.3%
MASTER'S DEGREE
0.4/ 100
METRIC RATING
267th/ 347
METRIC RANK
11.3%
MASTER'S DEGREE
0.1/ 100
METRIC RATING
304th/ 347
METRIC RANK
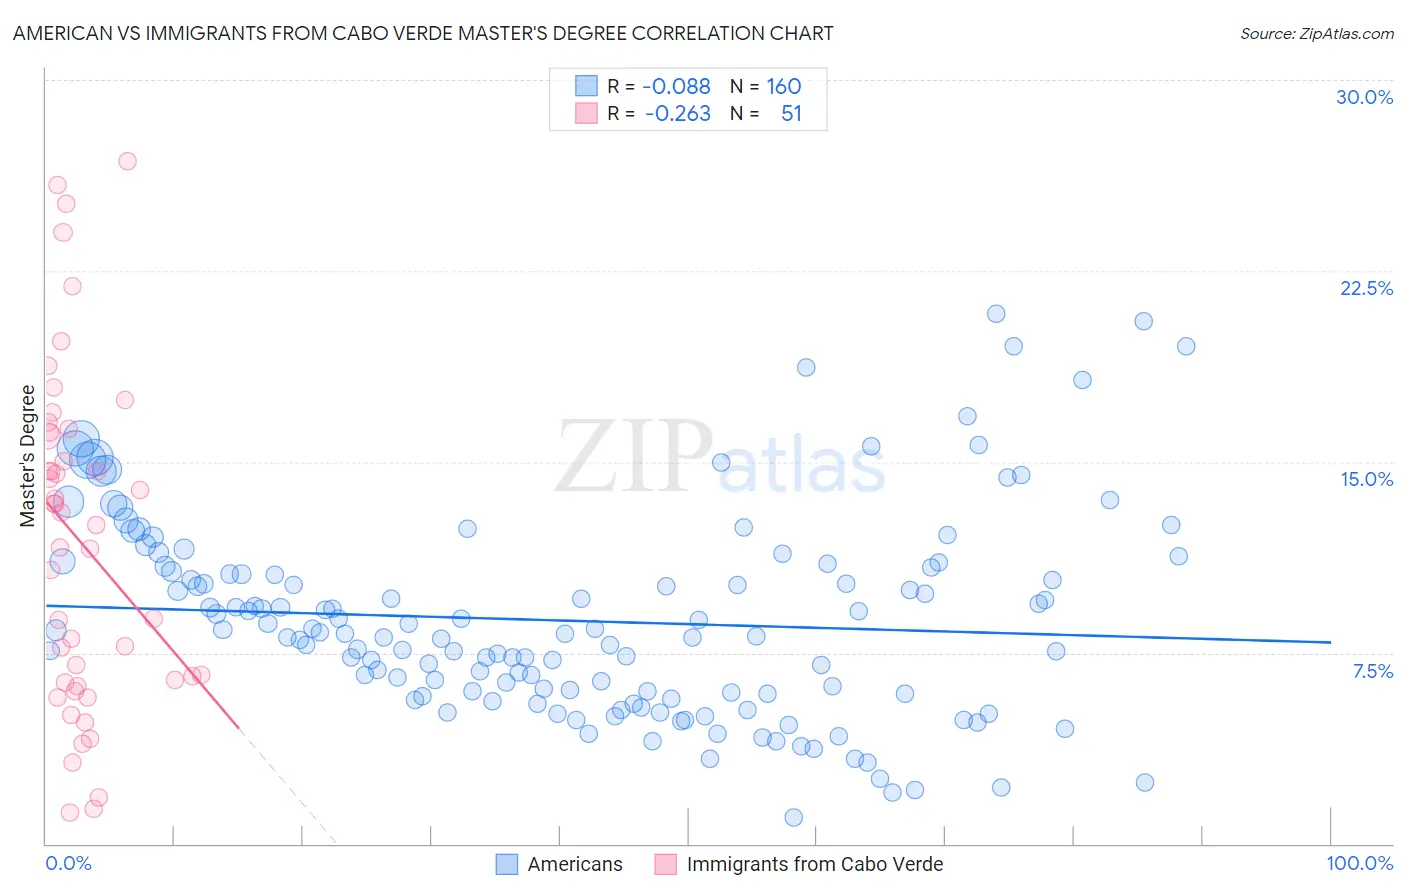
American vs Immigrants from Cabo Verde Master's Degree Correlation Chart
The statistical analysis conducted on geographies consisting of 580,510,045 people shows a slight negative correlation between the proportion of Americans and percentage of population with at least master's degree education in the United States with a correlation coefficient (R) of -0.088 and weighted average of 12.3%. Similarly, the statistical analysis conducted on geographies consisting of 38,158,316 people shows a weak negative correlation between the proportion of Immigrants from Cabo Verde and percentage of population with at least master's degree education in the United States with a correlation coefficient (R) of -0.263 and weighted average of 11.3%, a difference of 8.5%.
Master's Degree Correlation Summary
| Measurement | American | Immigrants from Cabo Verde |
| Minimum | 1.1% | 1.2% |
| Maximum | 20.8% | 26.8% |
| Range | 19.8% | 25.5% |
| Mean | 8.8% | 11.9% |
| Median | 8.3% | 12.5% |
| Interquartile 25% (IQ1) | 5.9% | 6.3% |
| Interquartile 75% (IQ3) | 10.8% | 16.1% |
| Interquartile Range (IQR) | 4.9% | 9.8% |
| Standard Deviation (Sample) | 3.9% | 6.6% |
| Standard Deviation (Population) | 3.9% | 6.5% |
Similar Demographics by Master's Degree
Demographics Similar to Americans by Master's Degree
In terms of master's degree, the demographic groups most similar to Americans are Native Hawaiian (12.3%, a difference of 0.25%), Bahamian (12.4%, a difference of 0.76%), Central American (12.2%, a difference of 0.90%), Immigrants from Fiji (12.4%, a difference of 0.91%), and Belizean (12.4%, a difference of 0.93%).
| Demographics | Rating | Rank | Master's Degree |
| Dominicans | 0.6 /100 | #260 | Tragic 12.5% |
| Tongans | 0.6 /100 | #261 | Tragic 12.5% |
| Nicaraguans | 0.6 /100 | #262 | Tragic 12.5% |
| Central American Indians | 0.5 /100 | #263 | Tragic 12.4% |
| Belizeans | 0.5 /100 | #264 | Tragic 12.4% |
| Immigrants | Fiji | 0.5 /100 | #265 | Tragic 12.4% |
| Bahamians | 0.5 /100 | #266 | Tragic 12.4% |
| Americans | 0.4 /100 | #267 | Tragic 12.3% |
| Native Hawaiians | 0.4 /100 | #268 | Tragic 12.3% |
| Central Americans | 0.3 /100 | #269 | Tragic 12.2% |
| Salvadorans | 0.3 /100 | #270 | Tragic 12.2% |
| Haitians | 0.3 /100 | #271 | Tragic 12.1% |
| Comanche | 0.3 /100 | #272 | Tragic 12.1% |
| Blackfeet | 0.3 /100 | #273 | Tragic 12.1% |
| Cape Verdeans | 0.3 /100 | #274 | Tragic 12.1% |
Demographics Similar to Immigrants from Cabo Verde by Master's Degree
In terms of master's degree, the demographic groups most similar to Immigrants from Cabo Verde are Immigrants from Laos (11.4%, a difference of 0.19%), Cherokee (11.4%, a difference of 0.21%), Tsimshian (11.4%, a difference of 0.52%), Immigrants from Latin America (11.3%, a difference of 0.65%), and Chippewa (11.4%, a difference of 0.68%).
| Demographics | Rating | Rank | Master's Degree |
| Immigrants | Yemen | 0.1 /100 | #297 | Tragic 11.6% |
| Samoans | 0.1 /100 | #298 | Tragic 11.5% |
| Chickasaw | 0.1 /100 | #299 | Tragic 11.4% |
| Chippewa | 0.1 /100 | #300 | Tragic 11.4% |
| Tsimshian | 0.1 /100 | #301 | Tragic 11.4% |
| Cherokee | 0.1 /100 | #302 | Tragic 11.4% |
| Immigrants | Laos | 0.1 /100 | #303 | Tragic 11.4% |
| Immigrants | Cabo Verde | 0.1 /100 | #304 | Tragic 11.3% |
| Immigrants | Latin America | 0.0 /100 | #305 | Tragic 11.3% |
| Mexican American Indians | 0.0 /100 | #306 | Tragic 11.2% |
| Cheyenne | 0.0 /100 | #307 | Tragic 11.2% |
| Puerto Ricans | 0.0 /100 | #308 | Tragic 11.2% |
| Puget Sound Salish | 0.0 /100 | #309 | Tragic 11.1% |
| Shoshone | 0.0 /100 | #310 | Tragic 11.1% |
| Seminole | 0.0 /100 | #311 | Tragic 11.0% |