Immigrants from Syria vs Costa Rican Associate's Degree
COMPARE
Immigrants from Syria
Costa Rican
Associate's Degree
Associate's Degree Comparison
Immigrants from Syria
Costa Ricans
48.5%
ASSOCIATE'S DEGREE
92.2/ 100
METRIC RATING
126th/ 347
METRIC RANK
46.0%
ASSOCIATE'S DEGREE
38.6/ 100
METRIC RATING
185th/ 347
METRIC RANK
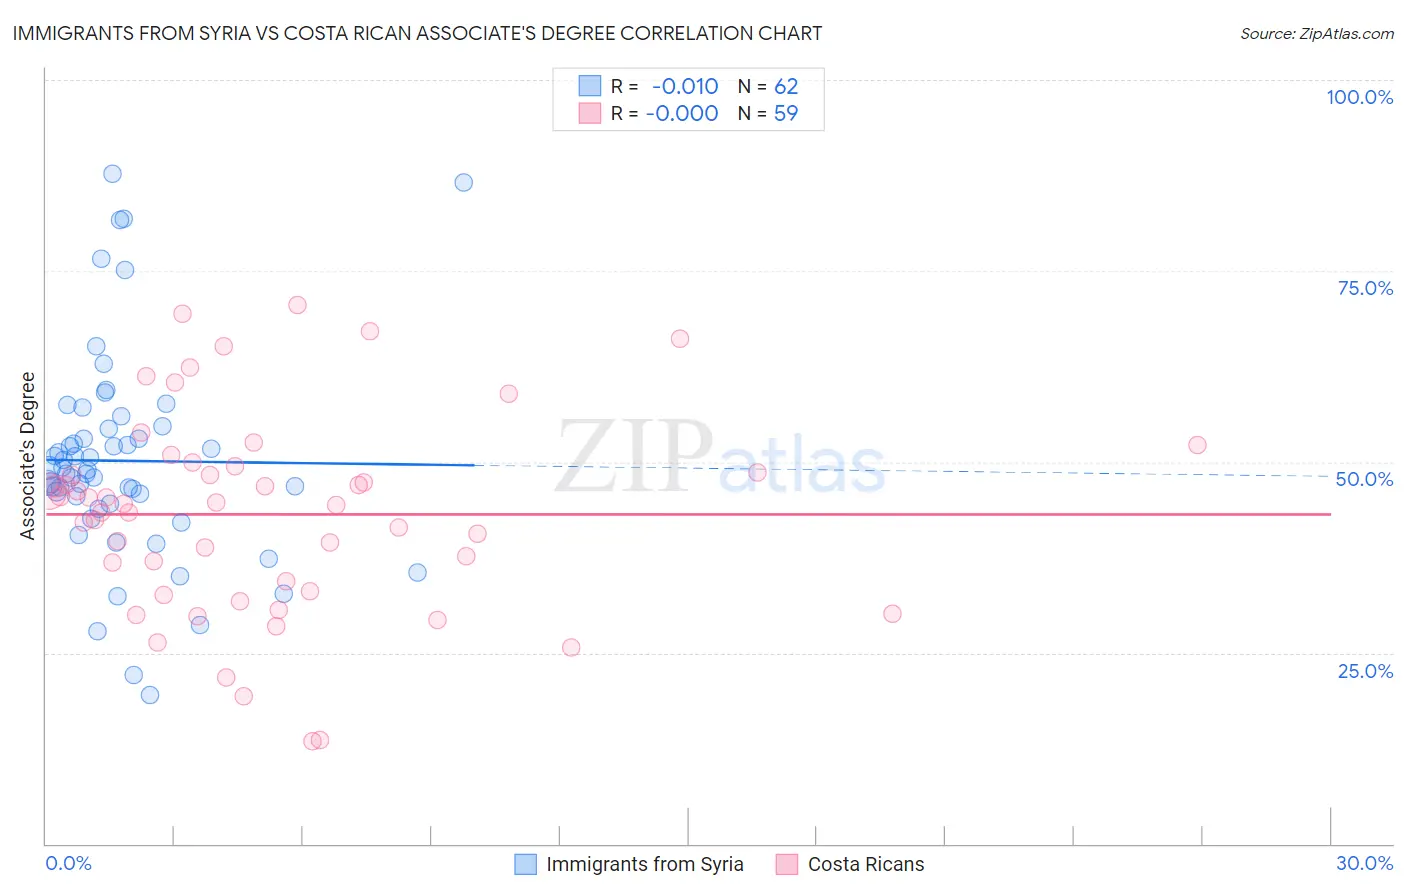
Immigrants from Syria vs Costa Rican Associate's Degree Correlation Chart
The statistical analysis conducted on geographies consisting of 174,109,130 people shows no correlation between the proportion of Immigrants from Syria and percentage of population with at least associate's degree education in the United States with a correlation coefficient (R) of -0.010 and weighted average of 48.5%. Similarly, the statistical analysis conducted on geographies consisting of 253,596,799 people shows no correlation between the proportion of Costa Ricans and percentage of population with at least associate's degree education in the United States with a correlation coefficient (R) of -0.000 and weighted average of 46.0%, a difference of 5.5%.
Associate's Degree Correlation Summary
| Measurement | Immigrants from Syria | Costa Rican |
| Minimum | 19.4% | 13.4% |
| Maximum | 87.7% | 70.5% |
| Range | 68.3% | 57.2% |
| Mean | 50.1% | 43.1% |
| Median | 48.8% | 44.5% |
| Interquartile 25% (IQ1) | 44.5% | 33.0% |
| Interquartile 75% (IQ3) | 54.4% | 49.5% |
| Interquartile Range (IQR) | 9.9% | 16.5% |
| Standard Deviation (Sample) | 13.7% | 13.1% |
| Standard Deviation (Population) | 13.6% | 13.0% |
Similar Demographics by Associate's Degree
Demographics Similar to Immigrants from Syria by Associate's Degree
In terms of associate's degree, the demographic groups most similar to Immigrants from Syria are Immigrants from Uganda (48.5%, a difference of 0.010%), Chinese (48.5%, a difference of 0.090%), Serbian (48.5%, a difference of 0.10%), Immigrants from Eastern Africa (48.4%, a difference of 0.13%), and Swedish (48.4%, a difference of 0.16%).
| Demographics | Rating | Rank | Associate's Degree |
| Lebanese | 94.6 /100 | #119 | Exceptional 48.8% |
| Alsatians | 94.6 /100 | #120 | Exceptional 48.8% |
| Ugandans | 93.9 /100 | #121 | Exceptional 48.7% |
| Italians | 93.9 /100 | #122 | Exceptional 48.7% |
| Brazilians | 93.7 /100 | #123 | Exceptional 48.7% |
| Serbians | 92.6 /100 | #124 | Exceptional 48.5% |
| Chinese | 92.5 /100 | #125 | Exceptional 48.5% |
| Immigrants | Syria | 92.2 /100 | #126 | Exceptional 48.5% |
| Immigrants | Uganda | 92.1 /100 | #127 | Exceptional 48.5% |
| Immigrants | Eastern Africa | 91.6 /100 | #128 | Exceptional 48.4% |
| Swedes | 91.5 /100 | #129 | Exceptional 48.4% |
| Immigrants | Jordan | 91.2 /100 | #130 | Exceptional 48.4% |
| Icelanders | 90.8 /100 | #131 | Exceptional 48.3% |
| Immigrants | Albania | 89.9 /100 | #132 | Excellent 48.2% |
| Assyrians/Chaldeans/Syriacs | 89.4 /100 | #133 | Excellent 48.2% |
Demographics Similar to Costa Ricans by Associate's Degree
In terms of associate's degree, the demographic groups most similar to Costa Ricans are Welsh (45.9%, a difference of 0.060%), Czechoslovakian (46.0%, a difference of 0.11%), Yugoslavian (46.0%, a difference of 0.13%), Swiss (46.0%, a difference of 0.14%), and Immigrants from Colombia (46.0%, a difference of 0.21%).
| Demographics | Rating | Rank | Associate's Degree |
| Immigrants | Bosnia and Herzegovina | 48.3 /100 | #178 | Average 46.3% |
| Sri Lankans | 47.6 /100 | #179 | Average 46.3% |
| Bermudans | 46.4 /100 | #180 | Average 46.2% |
| Immigrants | Colombia | 41.3 /100 | #181 | Average 46.0% |
| Swiss | 40.4 /100 | #182 | Average 46.0% |
| Yugoslavians | 40.2 /100 | #183 | Average 46.0% |
| Czechoslovakians | 40.0 /100 | #184 | Average 46.0% |
| Costa Ricans | 38.6 /100 | #185 | Fair 46.0% |
| Welsh | 37.9 /100 | #186 | Fair 45.9% |
| Immigrants | Uruguay | 35.5 /100 | #187 | Fair 45.8% |
| Ghanaians | 35.5 /100 | #188 | Fair 45.8% |
| Immigrants | Oceania | 34.7 /100 | #189 | Fair 45.8% |
| Vietnamese | 34.0 /100 | #190 | Fair 45.8% |
| Koreans | 33.8 /100 | #191 | Fair 45.8% |
| Celtics | 33.3 /100 | #192 | Fair 45.8% |