Dutch vs Alaskan Athabascan College, 1 year or more
COMPARE
Dutch
Alaskan Athabascan
College, 1 year or more
College, 1 year or more Comparison
Dutch
Alaskan Athabascans
58.6%
COLLEGE, 1 YEAR OR MORE
26.2/ 100
METRIC RATING
195th/ 347
METRIC RANK
53.4%
COLLEGE, 1 YEAR OR MORE
0.0/ 100
METRIC RATING
290th/ 347
METRIC RANK
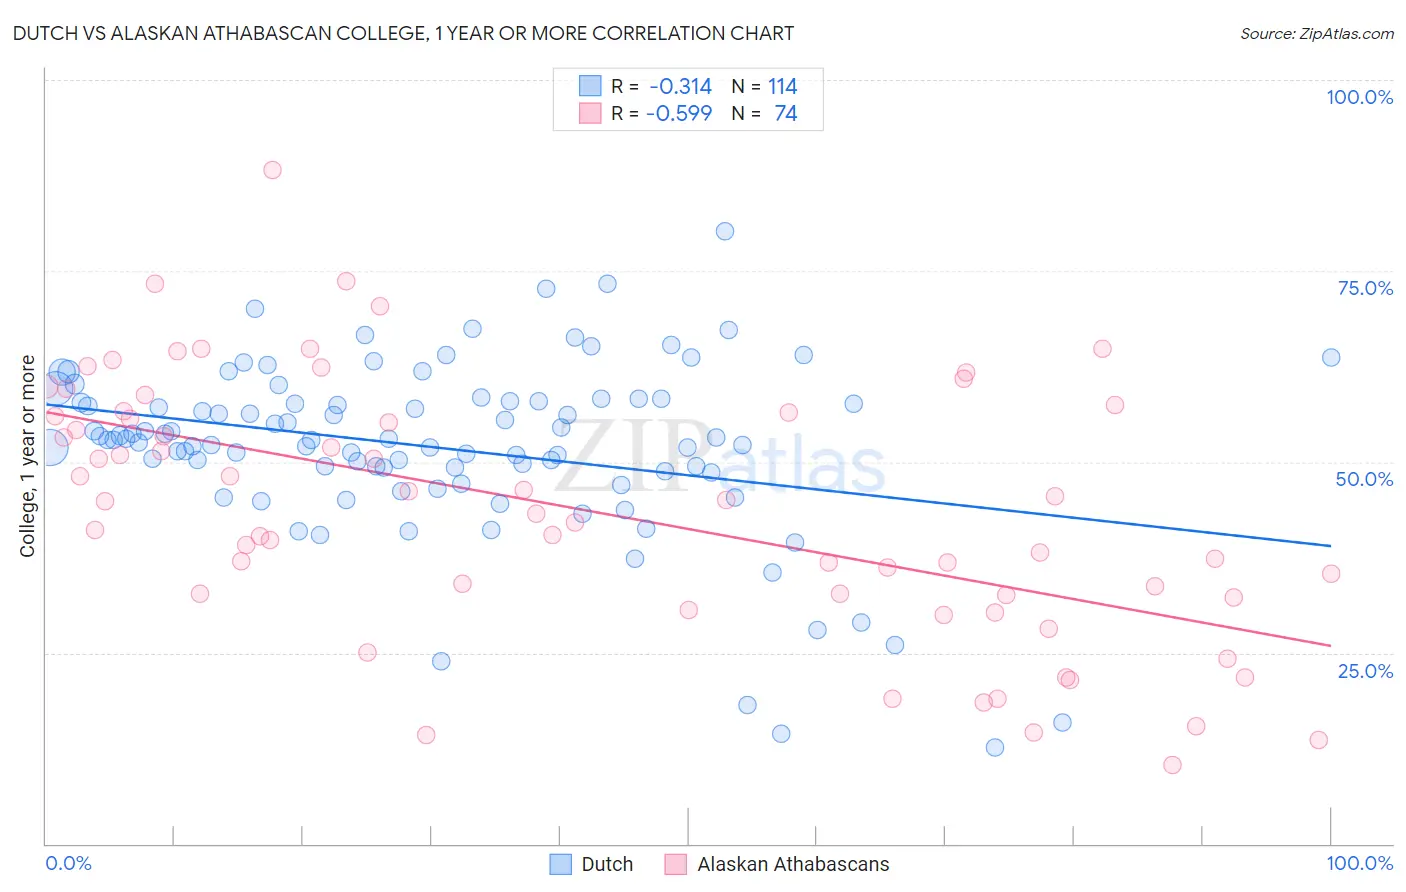
Dutch vs Alaskan Athabascan College, 1 year or more Correlation Chart
The statistical analysis conducted on geographies consisting of 554,349,902 people shows a mild negative correlation between the proportion of Dutch and percentage of population with at least college, 1 year or more education in the United States with a correlation coefficient (R) of -0.314 and weighted average of 58.6%. Similarly, the statistical analysis conducted on geographies consisting of 45,820,330 people shows a substantial negative correlation between the proportion of Alaskan Athabascans and percentage of population with at least college, 1 year or more education in the United States with a correlation coefficient (R) of -0.599 and weighted average of 53.4%, a difference of 9.7%.
College, 1 year or more Correlation Summary
| Measurement | Dutch | Alaskan Athabascan |
| Minimum | 12.6% | 10.3% |
| Maximum | 80.2% | 88.2% |
| Range | 67.6% | 77.9% |
| Mean | 51.9% | 43.6% |
| Median | 52.9% | 44.1% |
| Interquartile 25% (IQ1) | 48.7% | 32.5% |
| Interquartile 75% (IQ3) | 58.0% | 56.5% |
| Interquartile Range (IQR) | 9.3% | 24.0% |
| Standard Deviation (Sample) | 11.6% | 16.8% |
| Standard Deviation (Population) | 11.5% | 16.7% |
Similar Demographics by College, 1 year or more
Demographics Similar to Dutch by College, 1 year or more
In terms of college, 1 year or more, the demographic groups most similar to Dutch are Guamanian/Chamorro (58.6%, a difference of 0.0%), Immigrants from Thailand (58.6%, a difference of 0.010%), Costa Rican (58.6%, a difference of 0.020%), Immigrants from South Eastern Asia (58.5%, a difference of 0.080%), and Peruvian (58.6%, a difference of 0.090%).
| Demographics | Rating | Rank | College, 1 year or more |
| French | 34.4 /100 | #188 | Fair 58.9% |
| Uruguayans | 31.8 /100 | #189 | Fair 58.8% |
| Immigrants | Cameroon | 31.2 /100 | #190 | Fair 58.8% |
| Immigrants | Philippines | 29.2 /100 | #191 | Fair 58.7% |
| Colombians | 27.6 /100 | #192 | Fair 58.7% |
| Peruvians | 27.5 /100 | #193 | Fair 58.6% |
| Costa Ricans | 26.4 /100 | #194 | Fair 58.6% |
| Dutch | 26.2 /100 | #195 | Fair 58.6% |
| Guamanians/Chamorros | 26.2 /100 | #196 | Fair 58.6% |
| Immigrants | Thailand | 26.0 /100 | #197 | Fair 58.6% |
| Immigrants | South Eastern Asia | 25.1 /100 | #198 | Fair 58.5% |
| Slovaks | 24.6 /100 | #199 | Fair 58.5% |
| Spanish | 24.2 /100 | #200 | Fair 58.5% |
| Nigerians | 23.0 /100 | #201 | Fair 58.5% |
| Immigrants | South America | 21.9 /100 | #202 | Fair 58.4% |
Demographics Similar to Alaskan Athabascans by College, 1 year or more
In terms of college, 1 year or more, the demographic groups most similar to Alaskan Athabascans are Alaska Native (53.4%, a difference of 0.020%), Immigrants from Ecuador (53.4%, a difference of 0.020%), Cuban (53.4%, a difference of 0.050%), Chickasaw (53.3%, a difference of 0.18%), and Immigrants from Belize (53.5%, a difference of 0.19%).
| Demographics | Rating | Rank | College, 1 year or more |
| Nicaraguans | 0.1 /100 | #283 | Tragic 53.9% |
| Ute | 0.1 /100 | #284 | Tragic 53.8% |
| Immigrants | Guyana | 0.1 /100 | #285 | Tragic 53.5% |
| Central American Indians | 0.1 /100 | #286 | Tragic 53.5% |
| Immigrants | Belize | 0.1 /100 | #287 | Tragic 53.5% |
| Alaska Natives | 0.0 /100 | #288 | Tragic 53.4% |
| Immigrants | Ecuador | 0.0 /100 | #289 | Tragic 53.4% |
| Alaskan Athabascans | 0.0 /100 | #290 | Tragic 53.4% |
| Cubans | 0.0 /100 | #291 | Tragic 53.4% |
| Chickasaw | 0.0 /100 | #292 | Tragic 53.3% |
| Blacks/African Americans | 0.0 /100 | #293 | Tragic 53.3% |
| Cherokee | 0.0 /100 | #294 | Tragic 53.2% |
| Yaqui | 0.0 /100 | #295 | Tragic 53.2% |
| Sioux | 0.0 /100 | #296 | Tragic 53.0% |
| Paiute | 0.0 /100 | #297 | Tragic 52.9% |