Immigrants from Portugal vs Alaskan Athabascan College, 1 year or more
COMPARE
Immigrants from Portugal
Alaskan Athabascan
College, 1 year or more
College, 1 year or more Comparison
Immigrants from Portugal
Alaskan Athabascans
51.9%
COLLEGE, 1 YEAR OR MORE
0.0/ 100
METRIC RATING
307th/ 347
METRIC RANK
53.4%
COLLEGE, 1 YEAR OR MORE
0.0/ 100
METRIC RATING
290th/ 347
METRIC RANK
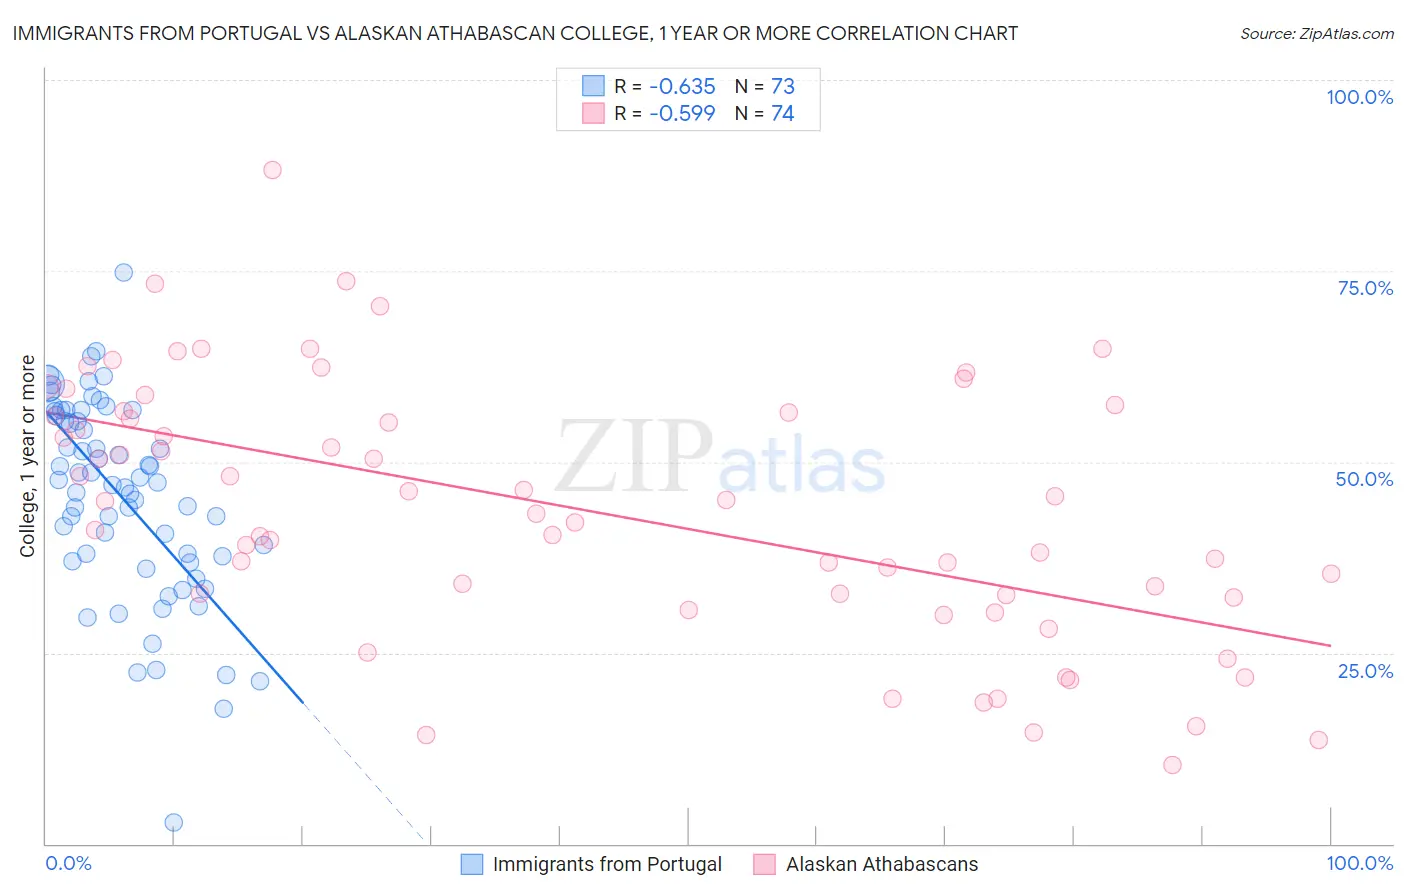
Immigrants from Portugal vs Alaskan Athabascan College, 1 year or more Correlation Chart
The statistical analysis conducted on geographies consisting of 174,792,609 people shows a significant negative correlation between the proportion of Immigrants from Portugal and percentage of population with at least college, 1 year or more education in the United States with a correlation coefficient (R) of -0.635 and weighted average of 51.9%. Similarly, the statistical analysis conducted on geographies consisting of 45,820,330 people shows a substantial negative correlation between the proportion of Alaskan Athabascans and percentage of population with at least college, 1 year or more education in the United States with a correlation coefficient (R) of -0.599 and weighted average of 53.4%, a difference of 3.0%.
College, 1 year or more Correlation Summary
| Measurement | Immigrants from Portugal | Alaskan Athabascan |
| Minimum | 2.8% | 10.3% |
| Maximum | 74.9% | 88.2% |
| Range | 72.1% | 77.9% |
| Mean | 45.5% | 43.6% |
| Median | 47.3% | 44.1% |
| Interquartile 25% (IQ1) | 37.3% | 32.5% |
| Interquartile 75% (IQ3) | 56.3% | 56.5% |
| Interquartile Range (IQR) | 19.0% | 24.0% |
| Standard Deviation (Sample) | 13.0% | 16.8% |
| Standard Deviation (Population) | 12.9% | 16.7% |
Demographics Similar to Immigrants from Portugal and Alaskan Athabascans by College, 1 year or more
In terms of college, 1 year or more, the demographic groups most similar to Immigrants from Portugal are Mexican American Indian (51.9%, a difference of 0.10%), Salvadoran (51.8%, a difference of 0.10%), Seminole (52.1%, a difference of 0.44%), Central American (52.1%, a difference of 0.53%), and Creek (52.2%, a difference of 0.67%). Similarly, the demographic groups most similar to Alaskan Athabascans are Alaska Native (53.4%, a difference of 0.020%), Immigrants from Ecuador (53.4%, a difference of 0.020%), Cuban (53.4%, a difference of 0.050%), Chickasaw (53.3%, a difference of 0.18%), and Black/African American (53.3%, a difference of 0.20%).
| Demographics | Rating | Rank | College, 1 year or more |
| Alaska Natives | 0.0 /100 | #288 | Tragic 53.4% |
| Immigrants | Ecuador | 0.0 /100 | #289 | Tragic 53.4% |
| Alaskan Athabascans | 0.0 /100 | #290 | Tragic 53.4% |
| Cubans | 0.0 /100 | #291 | Tragic 53.4% |
| Chickasaw | 0.0 /100 | #292 | Tragic 53.3% |
| Blacks/African Americans | 0.0 /100 | #293 | Tragic 53.3% |
| Cherokee | 0.0 /100 | #294 | Tragic 53.2% |
| Yaqui | 0.0 /100 | #295 | Tragic 53.2% |
| Sioux | 0.0 /100 | #296 | Tragic 53.0% |
| Paiute | 0.0 /100 | #297 | Tragic 52.9% |
| Immigrants | Dominica | 0.0 /100 | #298 | Tragic 52.5% |
| Immigrants | Nicaragua | 0.0 /100 | #299 | Tragic 52.4% |
| Choctaw | 0.0 /100 | #300 | Tragic 52.3% |
| Haitians | 0.0 /100 | #301 | Tragic 52.3% |
| Puerto Ricans | 0.0 /100 | #302 | Tragic 52.2% |
| Creek | 0.0 /100 | #303 | Tragic 52.2% |
| Central Americans | 0.0 /100 | #304 | Tragic 52.1% |
| Seminole | 0.0 /100 | #305 | Tragic 52.1% |
| Mexican American Indians | 0.0 /100 | #306 | Tragic 51.9% |
| Immigrants | Portugal | 0.0 /100 | #307 | Tragic 51.9% |
| Salvadorans | 0.0 /100 | #308 | Tragic 51.8% |