Cuban vs Trinidadian and Tobagonian 11th Grade
COMPARE
Cuban
Trinidadian and Tobagonian
11th Grade
11th Grade Comparison
Cubans
Trinidadians and Tobagonians
90.2%
11TH GRADE
0.0/ 100
METRIC RATING
292nd/ 347
METRIC RANK
91.1%
11TH GRADE
0.2/ 100
METRIC RATING
270th/ 347
METRIC RANK
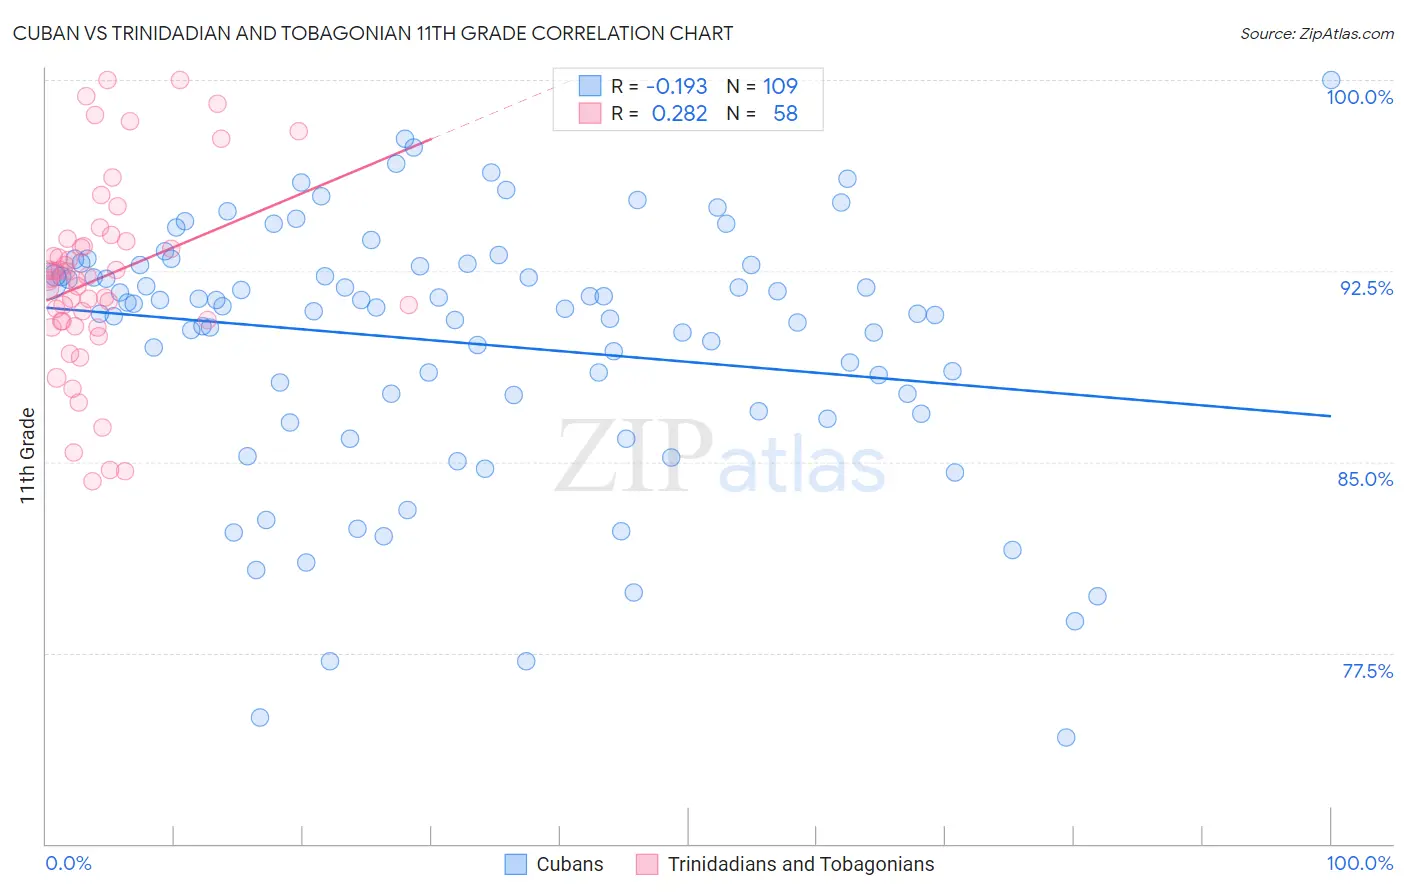
Cuban vs Trinidadian and Tobagonian 11th Grade Correlation Chart
The statistical analysis conducted on geographies consisting of 449,369,652 people shows a poor negative correlation between the proportion of Cubans and percentage of population with at least 11th grade education in the United States with a correlation coefficient (R) of -0.193 and weighted average of 90.2%. Similarly, the statistical analysis conducted on geographies consisting of 219,881,170 people shows a weak positive correlation between the proportion of Trinidadians and Tobagonians and percentage of population with at least 11th grade education in the United States with a correlation coefficient (R) of 0.282 and weighted average of 91.1%, a difference of 0.90%.
11th Grade Correlation Summary
| Measurement | Cuban | Trinidadian and Tobagonian |
| Minimum | 74.2% | 84.2% |
| Maximum | 100.0% | 100.0% |
| Range | 25.8% | 15.8% |
| Mean | 89.7% | 92.2% |
| Median | 91.1% | 92.2% |
| Interquartile 25% (IQ1) | 87.3% | 90.5% |
| Interquartile 75% (IQ3) | 92.7% | 93.7% |
| Interquartile Range (IQR) | 5.4% | 3.2% |
| Standard Deviation (Sample) | 5.1% | 3.7% |
| Standard Deviation (Population) | 5.0% | 3.7% |
Similar Demographics by 11th Grade
Demographics Similar to Cubans by 11th Grade
In terms of 11th grade, the demographic groups most similar to Cubans are Haitian (90.3%, a difference of 0.030%), Indonesian (90.3%, a difference of 0.070%), Native/Alaskan (90.2%, a difference of 0.070%), British West Indian (90.3%, a difference of 0.090%), and Pennsylvania German (90.3%, a difference of 0.11%).
| Demographics | Rating | Rank | 11th Grade |
| Immigrants | Burma/Myanmar | 0.0 /100 | #285 | Tragic 90.4% |
| Immigrants | West Indies | 0.0 /100 | #286 | Tragic 90.4% |
| Apache | 0.0 /100 | #287 | Tragic 90.4% |
| Pennsylvania Germans | 0.0 /100 | #288 | Tragic 90.3% |
| British West Indians | 0.0 /100 | #289 | Tragic 90.3% |
| Indonesians | 0.0 /100 | #290 | Tragic 90.3% |
| Haitians | 0.0 /100 | #291 | Tragic 90.3% |
| Cubans | 0.0 /100 | #292 | Tragic 90.2% |
| Natives/Alaskans | 0.0 /100 | #293 | Tragic 90.2% |
| Immigrants | Grenada | 0.0 /100 | #294 | Tragic 90.1% |
| Immigrants | Vietnam | 0.0 /100 | #295 | Tragic 90.0% |
| Fijians | 0.0 /100 | #296 | Tragic 90.0% |
| Navajo | 0.0 /100 | #297 | Tragic 90.0% |
| Immigrants | Fiji | 0.0 /100 | #298 | Tragic 89.9% |
| Japanese | 0.0 /100 | #299 | Tragic 89.9% |
Demographics Similar to Trinidadians and Tobagonians by 11th Grade
In terms of 11th grade, the demographic groups most similar to Trinidadians and Tobagonians are Ute (91.1%, a difference of 0.030%), Immigrants from Peru (91.0%, a difference of 0.030%), West Indian (91.0%, a difference of 0.040%), U.S. Virgin Islander (91.1%, a difference of 0.060%), and Paiute (91.0%, a difference of 0.080%).
| Demographics | Rating | Rank | 11th Grade |
| Immigrants | Ghana | 0.3 /100 | #263 | Tragic 91.2% |
| Yup'ik | 0.3 /100 | #264 | Tragic 91.2% |
| Pueblo | 0.3 /100 | #265 | Tragic 91.2% |
| Immigrants | Western Africa | 0.3 /100 | #266 | Tragic 91.2% |
| Immigrants | Jamaica | 0.3 /100 | #267 | Tragic 91.2% |
| U.S. Virgin Islanders | 0.2 /100 | #268 | Tragic 91.1% |
| Ute | 0.2 /100 | #269 | Tragic 91.1% |
| Trinidadians and Tobagonians | 0.2 /100 | #270 | Tragic 91.1% |
| Immigrants | Peru | 0.1 /100 | #271 | Tragic 91.0% |
| West Indians | 0.1 /100 | #272 | Tragic 91.0% |
| Paiute | 0.1 /100 | #273 | Tragic 91.0% |
| Immigrants | Trinidad and Tobago | 0.1 /100 | #274 | Tragic 90.9% |
| Immigrants | South Eastern Asia | 0.1 /100 | #275 | Tragic 90.9% |
| Bangladeshis | 0.1 /100 | #276 | Tragic 90.9% |
| Immigrants | Congo | 0.1 /100 | #277 | Tragic 90.9% |