Immigrants from Vietnam vs Trinidadian and Tobagonian 11th Grade
COMPARE
Immigrants from Vietnam
Trinidadian and Tobagonian
11th Grade
11th Grade Comparison
Immigrants from Vietnam
Trinidadians and Tobagonians
90.0%
11TH GRADE
0.0/ 100
METRIC RATING
295th/ 347
METRIC RANK
91.1%
11TH GRADE
0.2/ 100
METRIC RATING
270th/ 347
METRIC RANK
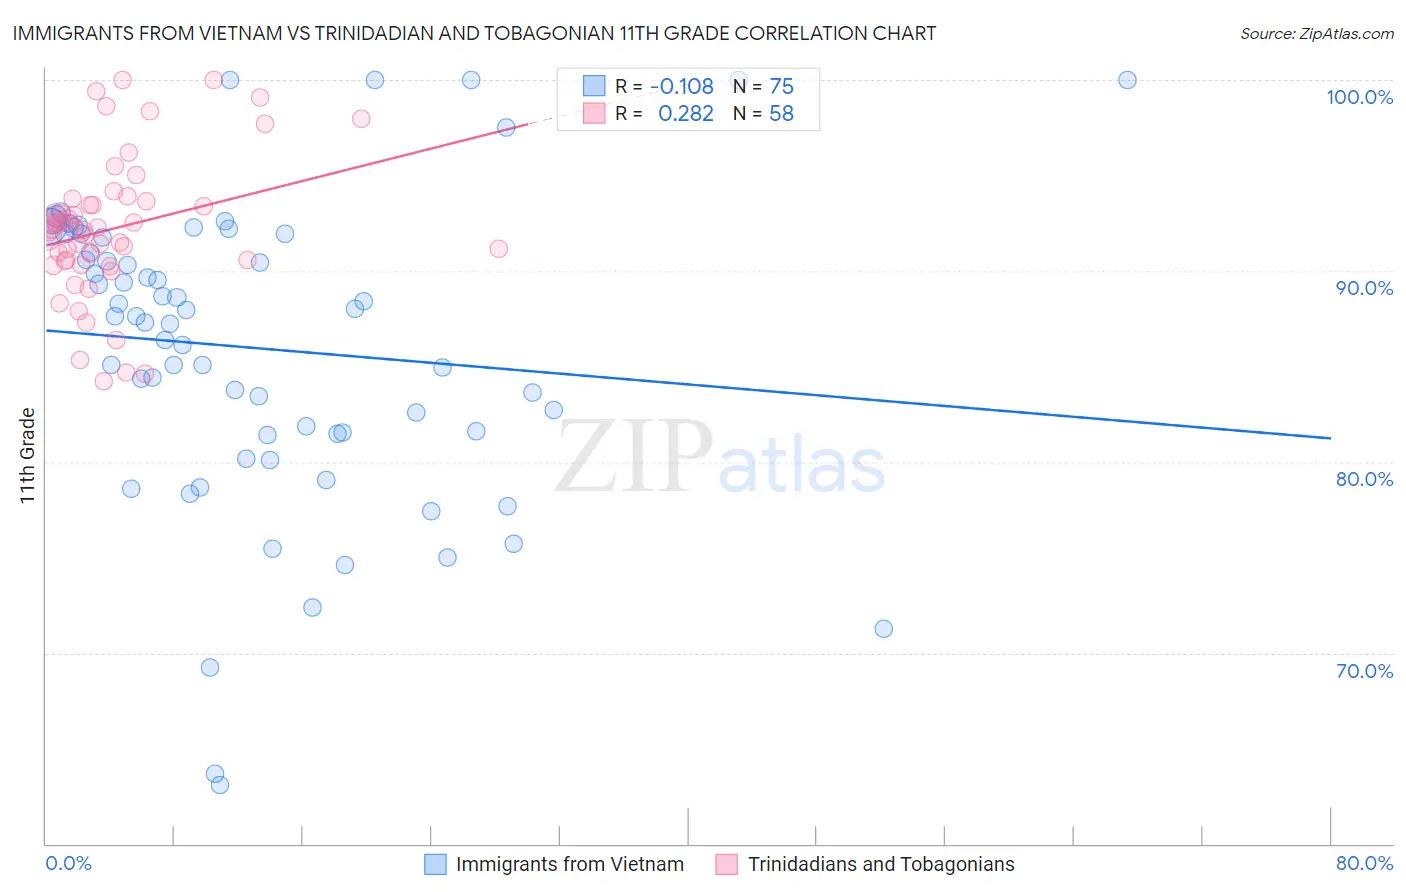
Immigrants from Vietnam vs Trinidadian and Tobagonian 11th Grade Correlation Chart
The statistical analysis conducted on geographies consisting of 404,843,921 people shows a poor negative correlation between the proportion of Immigrants from Vietnam and percentage of population with at least 11th grade education in the United States with a correlation coefficient (R) of -0.108 and weighted average of 90.0%. Similarly, the statistical analysis conducted on geographies consisting of 219,881,170 people shows a weak positive correlation between the proportion of Trinidadians and Tobagonians and percentage of population with at least 11th grade education in the United States with a correlation coefficient (R) of 0.282 and weighted average of 91.1%, a difference of 1.1%.
11th Grade Correlation Summary
| Measurement | Immigrants from Vietnam | Trinidadian and Tobagonian |
| Minimum | 63.1% | 84.2% |
| Maximum | 100.0% | 100.0% |
| Range | 36.9% | 15.8% |
| Mean | 85.9% | 92.2% |
| Median | 87.6% | 92.2% |
| Interquartile 25% (IQ1) | 81.5% | 90.5% |
| Interquartile 75% (IQ3) | 91.9% | 93.7% |
| Interquartile Range (IQR) | 10.4% | 3.2% |
| Standard Deviation (Sample) | 7.9% | 3.7% |
| Standard Deviation (Population) | 7.9% | 3.7% |
Similar Demographics by 11th Grade
Demographics Similar to Immigrants from Vietnam by 11th Grade
In terms of 11th grade, the demographic groups most similar to Immigrants from Vietnam are Fijian (90.0%, a difference of 0.020%), Navajo (90.0%, a difference of 0.060%), Immigrants from Grenada (90.1%, a difference of 0.11%), Immigrants from Fiji (89.9%, a difference of 0.13%), and Native/Alaskan (90.2%, a difference of 0.15%).
| Demographics | Rating | Rank | 11th Grade |
| Pennsylvania Germans | 0.0 /100 | #288 | Tragic 90.3% |
| British West Indians | 0.0 /100 | #289 | Tragic 90.3% |
| Indonesians | 0.0 /100 | #290 | Tragic 90.3% |
| Haitians | 0.0 /100 | #291 | Tragic 90.3% |
| Cubans | 0.0 /100 | #292 | Tragic 90.2% |
| Natives/Alaskans | 0.0 /100 | #293 | Tragic 90.2% |
| Immigrants | Grenada | 0.0 /100 | #294 | Tragic 90.1% |
| Immigrants | Vietnam | 0.0 /100 | #295 | Tragic 90.0% |
| Fijians | 0.0 /100 | #296 | Tragic 90.0% |
| Navajo | 0.0 /100 | #297 | Tragic 90.0% |
| Immigrants | Fiji | 0.0 /100 | #298 | Tragic 89.9% |
| Japanese | 0.0 /100 | #299 | Tragic 89.9% |
| Immigrants | Haiti | 0.0 /100 | #300 | Tragic 89.9% |
| Guyanese | 0.0 /100 | #301 | Tragic 89.9% |
| Immigrants | Guyana | 0.0 /100 | #302 | Tragic 89.7% |
Demographics Similar to Trinidadians and Tobagonians by 11th Grade
In terms of 11th grade, the demographic groups most similar to Trinidadians and Tobagonians are Ute (91.1%, a difference of 0.030%), Immigrants from Peru (91.0%, a difference of 0.030%), West Indian (91.0%, a difference of 0.040%), U.S. Virgin Islander (91.1%, a difference of 0.060%), and Paiute (91.0%, a difference of 0.080%).
| Demographics | Rating | Rank | 11th Grade |
| Immigrants | Ghana | 0.3 /100 | #263 | Tragic 91.2% |
| Yup'ik | 0.3 /100 | #264 | Tragic 91.2% |
| Pueblo | 0.3 /100 | #265 | Tragic 91.2% |
| Immigrants | Western Africa | 0.3 /100 | #266 | Tragic 91.2% |
| Immigrants | Jamaica | 0.3 /100 | #267 | Tragic 91.2% |
| U.S. Virgin Islanders | 0.2 /100 | #268 | Tragic 91.1% |
| Ute | 0.2 /100 | #269 | Tragic 91.1% |
| Trinidadians and Tobagonians | 0.2 /100 | #270 | Tragic 91.1% |
| Immigrants | Peru | 0.1 /100 | #271 | Tragic 91.0% |
| West Indians | 0.1 /100 | #272 | Tragic 91.0% |
| Paiute | 0.1 /100 | #273 | Tragic 91.0% |
| Immigrants | Trinidad and Tobago | 0.1 /100 | #274 | Tragic 90.9% |
| Immigrants | South Eastern Asia | 0.1 /100 | #275 | Tragic 90.9% |
| Bangladeshis | 0.1 /100 | #276 | Tragic 90.9% |
| Immigrants | Congo | 0.1 /100 | #277 | Tragic 90.9% |