Cheyenne vs Trinidadian and Tobagonian 11th Grade
COMPARE
Cheyenne
Trinidadian and Tobagonian
11th Grade
11th Grade Comparison
Cheyenne
Trinidadians and Tobagonians
91.8%
11TH GRADE
3.3/ 100
METRIC RATING
233rd/ 347
METRIC RANK
91.1%
11TH GRADE
0.2/ 100
METRIC RATING
270th/ 347
METRIC RANK
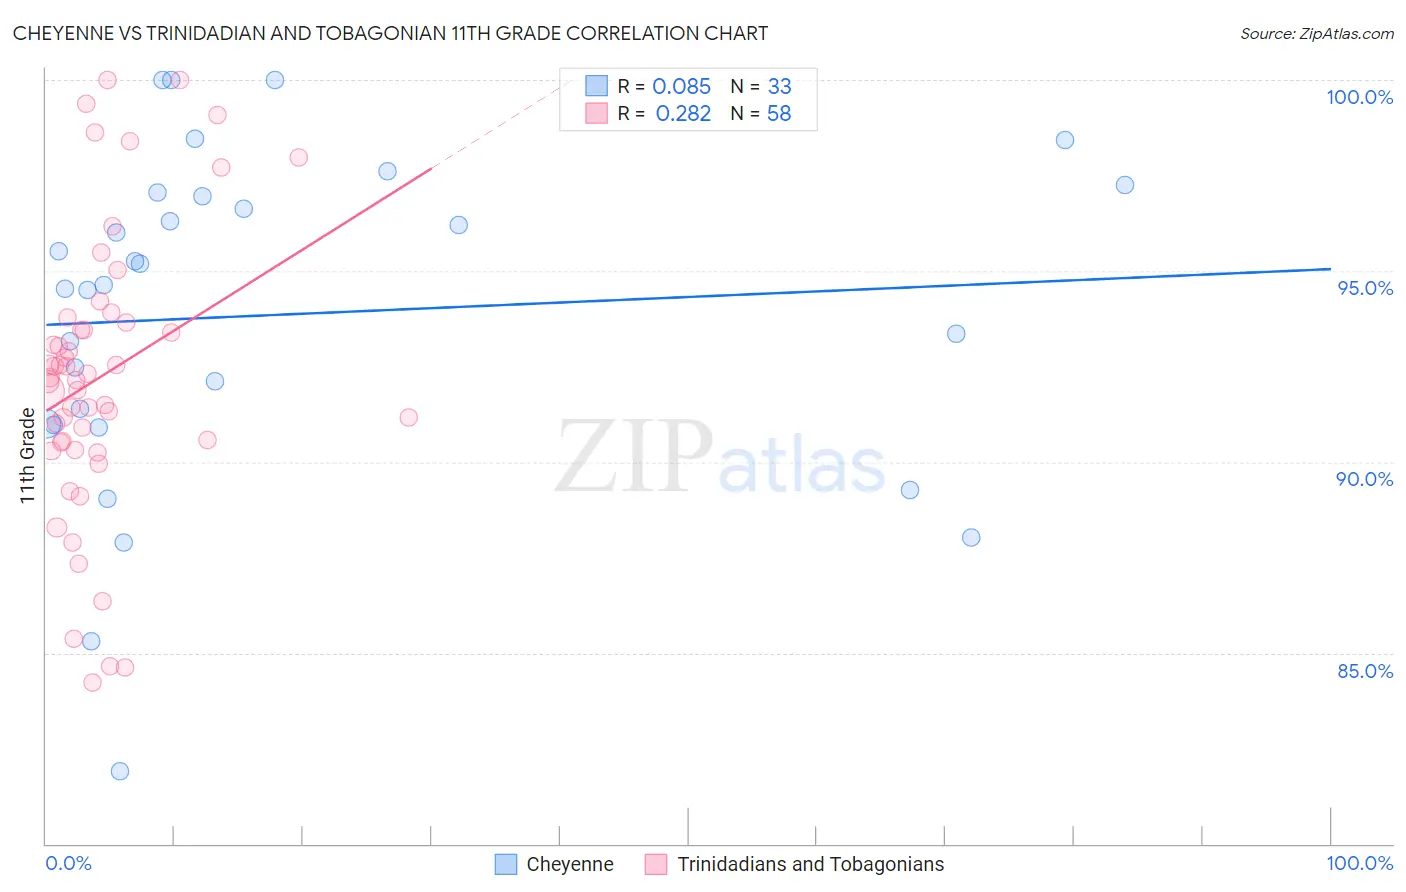
Cheyenne vs Trinidadian and Tobagonian 11th Grade Correlation Chart
The statistical analysis conducted on geographies consisting of 80,719,287 people shows a slight positive correlation between the proportion of Cheyenne and percentage of population with at least 11th grade education in the United States with a correlation coefficient (R) of 0.085 and weighted average of 91.8%. Similarly, the statistical analysis conducted on geographies consisting of 219,881,170 people shows a weak positive correlation between the proportion of Trinidadians and Tobagonians and percentage of population with at least 11th grade education in the United States with a correlation coefficient (R) of 0.282 and weighted average of 91.1%, a difference of 0.76%.
11th Grade Correlation Summary
| Measurement | Cheyenne | Trinidadian and Tobagonian |
| Minimum | 81.9% | 84.2% |
| Maximum | 100.0% | 100.0% |
| Range | 18.1% | 15.8% |
| Mean | 93.9% | 92.2% |
| Median | 94.6% | 92.2% |
| Interquartile 25% (IQ1) | 91.0% | 90.5% |
| Interquartile 75% (IQ3) | 97.0% | 93.7% |
| Interquartile Range (IQR) | 6.0% | 3.2% |
| Standard Deviation (Sample) | 4.3% | 3.7% |
| Standard Deviation (Population) | 4.3% | 3.7% |
Similar Demographics by 11th Grade
Demographics Similar to Cheyenne by 11th Grade
In terms of 11th grade, the demographic groups most similar to Cheyenne are Uruguayan (91.8%, a difference of 0.010%), Choctaw (91.8%, a difference of 0.030%), Armenian (91.7%, a difference of 0.030%), Subsaharan African (91.7%, a difference of 0.030%), and Immigrants from Afghanistan (91.8%, a difference of 0.040%).
| Demographics | Rating | Rank | 11th Grade |
| Immigrants | Somalia | 5.2 /100 | #226 | Tragic 91.9% |
| Immigrants | Cameroon | 4.4 /100 | #227 | Tragic 91.8% |
| Immigrants | Panama | 4.3 /100 | #228 | Tragic 91.8% |
| Nigerians | 4.3 /100 | #229 | Tragic 91.8% |
| Immigrants | Afghanistan | 3.9 /100 | #230 | Tragic 91.8% |
| Choctaw | 3.7 /100 | #231 | Tragic 91.8% |
| Uruguayans | 3.5 /100 | #232 | Tragic 91.8% |
| Cheyenne | 3.3 /100 | #233 | Tragic 91.8% |
| Armenians | 2.9 /100 | #234 | Tragic 91.7% |
| Sub-Saharan Africans | 2.9 /100 | #235 | Tragic 91.7% |
| Colombians | 2.8 /100 | #236 | Tragic 91.7% |
| Immigrants | Bolivia | 2.8 /100 | #237 | Tragic 91.7% |
| Comanche | 2.6 /100 | #238 | Tragic 91.7% |
| Hopi | 2.5 /100 | #239 | Tragic 91.7% |
| South Americans | 2.0 /100 | #240 | Tragic 91.6% |
Demographics Similar to Trinidadians and Tobagonians by 11th Grade
In terms of 11th grade, the demographic groups most similar to Trinidadians and Tobagonians are Ute (91.1%, a difference of 0.030%), Immigrants from Peru (91.0%, a difference of 0.030%), West Indian (91.0%, a difference of 0.040%), U.S. Virgin Islander (91.1%, a difference of 0.060%), and Paiute (91.0%, a difference of 0.080%).
| Demographics | Rating | Rank | 11th Grade |
| Immigrants | Ghana | 0.3 /100 | #263 | Tragic 91.2% |
| Yup'ik | 0.3 /100 | #264 | Tragic 91.2% |
| Pueblo | 0.3 /100 | #265 | Tragic 91.2% |
| Immigrants | Western Africa | 0.3 /100 | #266 | Tragic 91.2% |
| Immigrants | Jamaica | 0.3 /100 | #267 | Tragic 91.2% |
| U.S. Virgin Islanders | 0.2 /100 | #268 | Tragic 91.1% |
| Ute | 0.2 /100 | #269 | Tragic 91.1% |
| Trinidadians and Tobagonians | 0.2 /100 | #270 | Tragic 91.1% |
| Immigrants | Peru | 0.1 /100 | #271 | Tragic 91.0% |
| West Indians | 0.1 /100 | #272 | Tragic 91.0% |
| Paiute | 0.1 /100 | #273 | Tragic 91.0% |
| Immigrants | Trinidad and Tobago | 0.1 /100 | #274 | Tragic 90.9% |
| Immigrants | South Eastern Asia | 0.1 /100 | #275 | Tragic 90.9% |
| Bangladeshis | 0.1 /100 | #276 | Tragic 90.9% |
| Immigrants | Congo | 0.1 /100 | #277 | Tragic 90.9% |