Houma vs Celtic 10th Grade
COMPARE
Houma
Celtic
10th Grade
10th Grade Comparison
Houma
Celtics
90.2%
10TH GRADE
0.0/ 100
METRIC RATING
320th/ 347
METRIC RANK
95.0%
10TH GRADE
99.8/ 100
METRIC RATING
59th/ 347
METRIC RANK
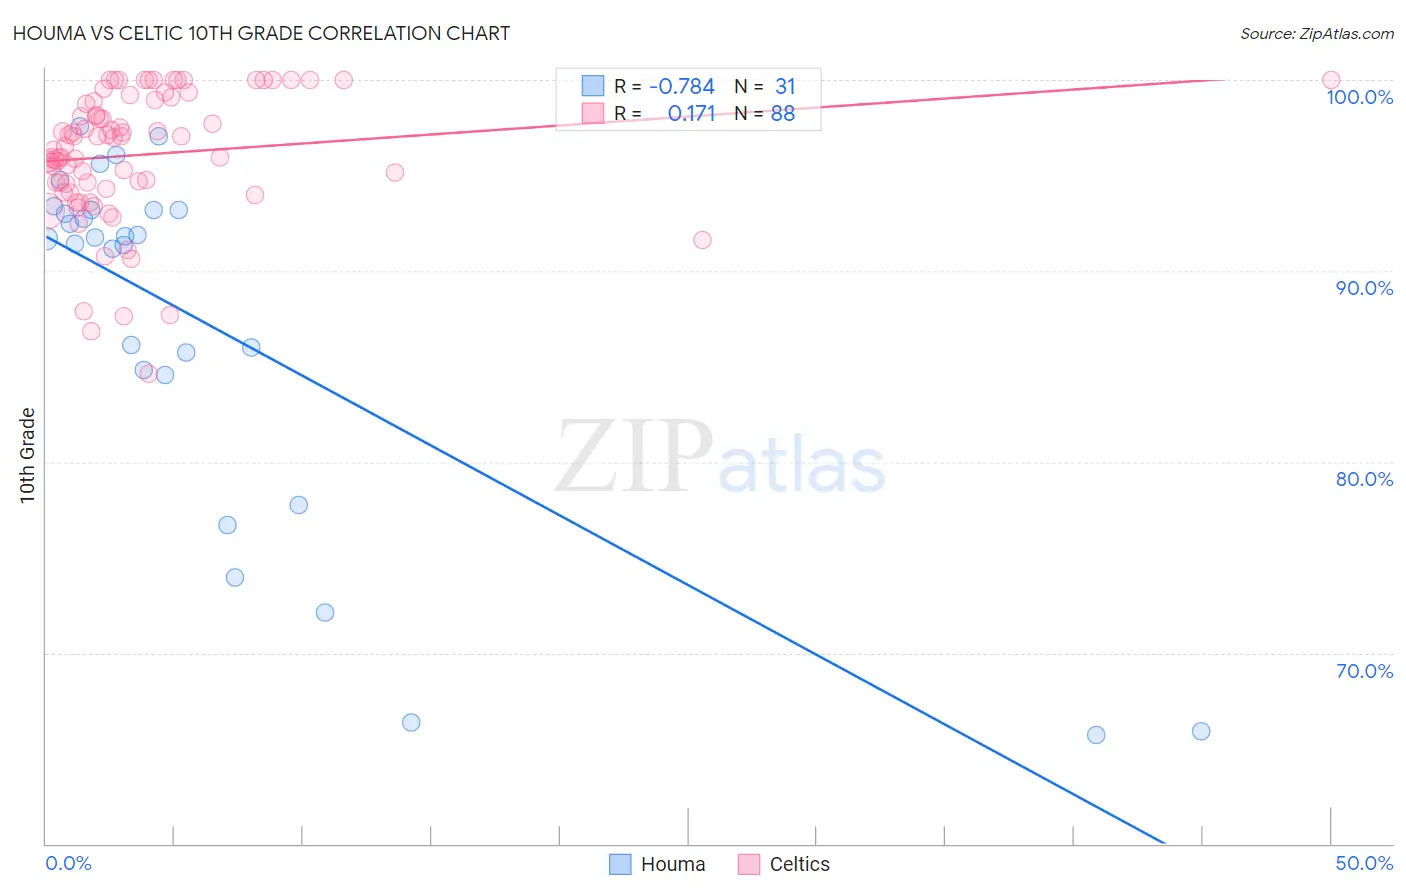
Houma vs Celtic 10th Grade Correlation Chart
The statistical analysis conducted on geographies consisting of 36,795,916 people shows a strong negative correlation between the proportion of Houma and percentage of population with at least 10th grade education in the United States with a correlation coefficient (R) of -0.784 and weighted average of 90.2%. Similarly, the statistical analysis conducted on geographies consisting of 168,876,981 people shows a poor positive correlation between the proportion of Celtics and percentage of population with at least 10th grade education in the United States with a correlation coefficient (R) of 0.171 and weighted average of 95.0%, a difference of 5.4%.
10th Grade Correlation Summary
| Measurement | Houma | Celtic |
| Minimum | 65.7% | 84.6% |
| Maximum | 97.6% | 100.0% |
| Range | 31.9% | 15.4% |
| Mean | 87.1% | 96.1% |
| Median | 91.7% | 96.8% |
| Interquartile 25% (IQ1) | 84.5% | 94.4% |
| Interquartile 75% (IQ3) | 93.2% | 98.9% |
| Interquartile Range (IQR) | 8.6% | 4.5% |
| Standard Deviation (Sample) | 9.6% | 3.4% |
| Standard Deviation (Population) | 9.4% | 3.4% |
Similar Demographics by 10th Grade
Demographics Similar to Houma by 10th Grade
In terms of 10th grade, the demographic groups most similar to Houma are Belizean (90.2%, a difference of 0.0%), Nicaraguan (90.2%, a difference of 0.010%), Tohono O'odham (90.1%, a difference of 0.010%), Immigrants from Cuba (90.2%, a difference of 0.090%), and Immigrants from Belize (90.1%, a difference of 0.11%).
| Demographics | Rating | Rank | 10th Grade |
| Cape Verdeans | 0.0 /100 | #313 | Tragic 90.8% |
| Nepalese | 0.0 /100 | #314 | Tragic 90.7% |
| Immigrants | Caribbean | 0.0 /100 | #315 | Tragic 90.6% |
| Ecuadorians | 0.0 /100 | #316 | Tragic 90.6% |
| Immigrants | Ecuador | 0.0 /100 | #317 | Tragic 90.4% |
| Immigrants | Cuba | 0.0 /100 | #318 | Tragic 90.2% |
| Nicaraguans | 0.0 /100 | #319 | Tragic 90.2% |
| Houma | 0.0 /100 | #320 | Tragic 90.2% |
| Belizeans | 0.0 /100 | #321 | Tragic 90.2% |
| Tohono O'odham | 0.0 /100 | #322 | Tragic 90.1% |
| Immigrants | Belize | 0.0 /100 | #323 | Tragic 90.1% |
| Immigrants | Armenia | 0.0 /100 | #324 | Tragic 89.9% |
| Puerto Ricans | 0.0 /100 | #325 | Tragic 89.8% |
| Central American Indians | 0.0 /100 | #326 | Tragic 89.7% |
| Immigrants | Nicaragua | 0.0 /100 | #327 | Tragic 89.5% |
Demographics Similar to Celtics by 10th Grade
In terms of 10th grade, the demographic groups most similar to Celtics are Aleut (95.0%, a difference of 0.0%), Immigrants from Ireland (95.0%, a difference of 0.010%), New Zealander (95.0%, a difference of 0.010%), Ukrainian (95.0%, a difference of 0.010%), and Cypriot (95.0%, a difference of 0.010%).
| Demographics | Rating | Rank | 10th Grade |
| Ottawa | 99.8 /100 | #52 | Exceptional 95.1% |
| Immigrants | North America | 99.8 /100 | #53 | Exceptional 95.0% |
| Immigrants | Lithuania | 99.8 /100 | #54 | Exceptional 95.0% |
| Immigrants | Ireland | 99.8 /100 | #55 | Exceptional 95.0% |
| New Zealanders | 99.8 /100 | #56 | Exceptional 95.0% |
| Ukrainians | 99.8 /100 | #57 | Exceptional 95.0% |
| Aleuts | 99.8 /100 | #58 | Exceptional 95.0% |
| Celtics | 99.8 /100 | #59 | Exceptional 95.0% |
| Cypriots | 99.8 /100 | #60 | Exceptional 95.0% |
| Chippewa | 99.8 /100 | #61 | Exceptional 95.0% |
| Thais | 99.8 /100 | #62 | Exceptional 95.0% |
| Immigrants | Singapore | 99.8 /100 | #63 | Exceptional 95.0% |
| Native Hawaiians | 99.7 /100 | #64 | Exceptional 95.0% |
| Turks | 99.7 /100 | #65 | Exceptional 95.0% |
| Immigrants | Australia | 99.7 /100 | #66 | Exceptional 94.9% |