Houma vs U.S. Virgin Islander 10th Grade
COMPARE
Houma
U.S. Virgin Islander
10th Grade
10th Grade Comparison
Houma
U.S. Virgin Islanders
90.2%
10TH GRADE
0.0/ 100
METRIC RATING
320th/ 347
METRIC RANK
92.7%
10TH GRADE
0.7/ 100
METRIC RATING
257th/ 347
METRIC RANK
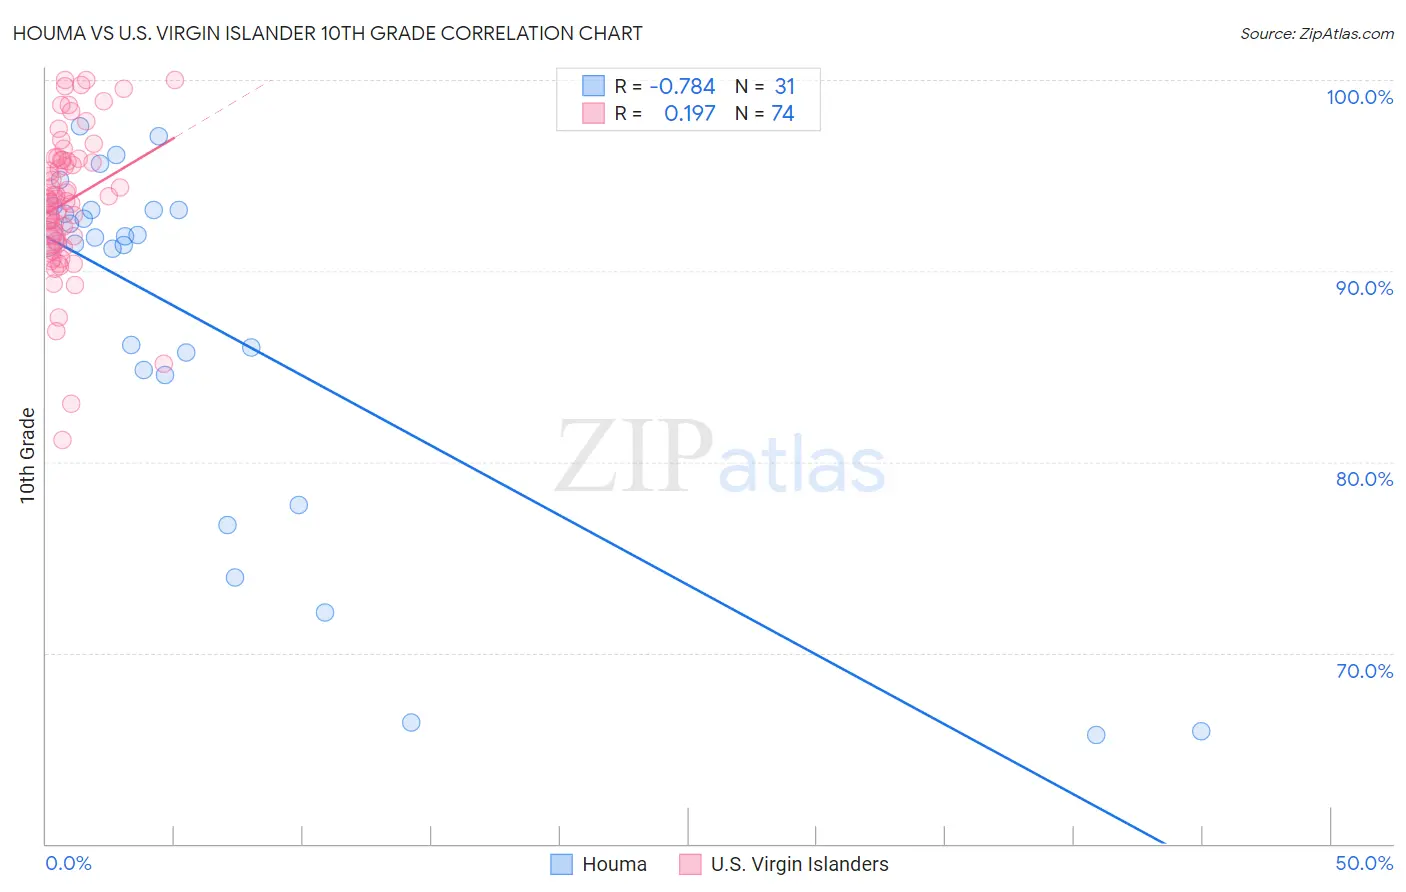
Houma vs U.S. Virgin Islander 10th Grade Correlation Chart
The statistical analysis conducted on geographies consisting of 36,795,916 people shows a strong negative correlation between the proportion of Houma and percentage of population with at least 10th grade education in the United States with a correlation coefficient (R) of -0.784 and weighted average of 90.2%. Similarly, the statistical analysis conducted on geographies consisting of 87,529,315 people shows a poor positive correlation between the proportion of U.S. Virgin Islanders and percentage of population with at least 10th grade education in the United States with a correlation coefficient (R) of 0.197 and weighted average of 92.7%, a difference of 2.8%.
10th Grade Correlation Summary
| Measurement | Houma | U.S. Virgin Islander |
| Minimum | 65.7% | 81.1% |
| Maximum | 97.6% | 100.0% |
| Range | 31.9% | 18.9% |
| Mean | 87.1% | 93.6% |
| Median | 91.7% | 93.8% |
| Interquartile 25% (IQ1) | 84.5% | 91.6% |
| Interquartile 75% (IQ3) | 93.2% | 95.8% |
| Interquartile Range (IQR) | 8.6% | 4.3% |
| Standard Deviation (Sample) | 9.6% | 3.7% |
| Standard Deviation (Population) | 9.4% | 3.7% |
Similar Demographics by 10th Grade
Demographics Similar to Houma by 10th Grade
In terms of 10th grade, the demographic groups most similar to Houma are Belizean (90.2%, a difference of 0.0%), Nicaraguan (90.2%, a difference of 0.010%), Tohono O'odham (90.1%, a difference of 0.010%), Immigrants from Cuba (90.2%, a difference of 0.090%), and Immigrants from Belize (90.1%, a difference of 0.11%).
| Demographics | Rating | Rank | 10th Grade |
| Cape Verdeans | 0.0 /100 | #313 | Tragic 90.8% |
| Nepalese | 0.0 /100 | #314 | Tragic 90.7% |
| Immigrants | Caribbean | 0.0 /100 | #315 | Tragic 90.6% |
| Ecuadorians | 0.0 /100 | #316 | Tragic 90.6% |
| Immigrants | Ecuador | 0.0 /100 | #317 | Tragic 90.4% |
| Immigrants | Cuba | 0.0 /100 | #318 | Tragic 90.2% |
| Nicaraguans | 0.0 /100 | #319 | Tragic 90.2% |
| Houma | 0.0 /100 | #320 | Tragic 90.2% |
| Belizeans | 0.0 /100 | #321 | Tragic 90.2% |
| Tohono O'odham | 0.0 /100 | #322 | Tragic 90.1% |
| Immigrants | Belize | 0.0 /100 | #323 | Tragic 90.1% |
| Immigrants | Armenia | 0.0 /100 | #324 | Tragic 89.9% |
| Puerto Ricans | 0.0 /100 | #325 | Tragic 89.8% |
| Central American Indians | 0.0 /100 | #326 | Tragic 89.7% |
| Immigrants | Nicaragua | 0.0 /100 | #327 | Tragic 89.5% |
Demographics Similar to U.S. Virgin Islanders by 10th Grade
In terms of 10th grade, the demographic groups most similar to U.S. Virgin Islanders are Immigrants from Nigeria (92.7%, a difference of 0.010%), Immigrants from Costa Rica (92.7%, a difference of 0.010%), Immigrants from Bolivia (92.7%, a difference of 0.020%), Immigrants from Jamaica (92.6%, a difference of 0.040%), and Immigrants from Uzbekistan (92.6%, a difference of 0.060%).
| Demographics | Rating | Rank | 10th Grade |
| Jamaicans | 1.2 /100 | #250 | Tragic 92.8% |
| Immigrants | Thailand | 1.0 /100 | #251 | Tragic 92.8% |
| South Americans | 0.9 /100 | #252 | Tragic 92.8% |
| Ghanaians | 0.9 /100 | #253 | Tragic 92.8% |
| Armenians | 0.9 /100 | #254 | Tragic 92.7% |
| Immigrants | Bolivia | 0.7 /100 | #255 | Tragic 92.7% |
| Immigrants | Nigeria | 0.7 /100 | #256 | Tragic 92.7% |
| U.S. Virgin Islanders | 0.7 /100 | #257 | Tragic 92.7% |
| Immigrants | Costa Rica | 0.6 /100 | #258 | Tragic 92.7% |
| Immigrants | Jamaica | 0.5 /100 | #259 | Tragic 92.6% |
| Immigrants | Uzbekistan | 0.5 /100 | #260 | Tragic 92.6% |
| Paiute | 0.4 /100 | #261 | Tragic 92.6% |
| Immigrants | South America | 0.4 /100 | #262 | Tragic 92.6% |
| Apache | 0.4 /100 | #263 | Tragic 92.6% |
| Peruvians | 0.4 /100 | #264 | Tragic 92.6% |