Immigrants from Singapore vs Scotch-Irish 10th Grade
COMPARE
Immigrants from Singapore
Scotch-Irish
10th Grade
10th Grade Comparison
Immigrants from Singapore
Scotch-Irish
95.0%
10TH GRADE
99.8/ 100
METRIC RATING
63rd/ 347
METRIC RANK
95.2%
10TH GRADE
99.9/ 100
METRIC RATING
40th/ 347
METRIC RANK
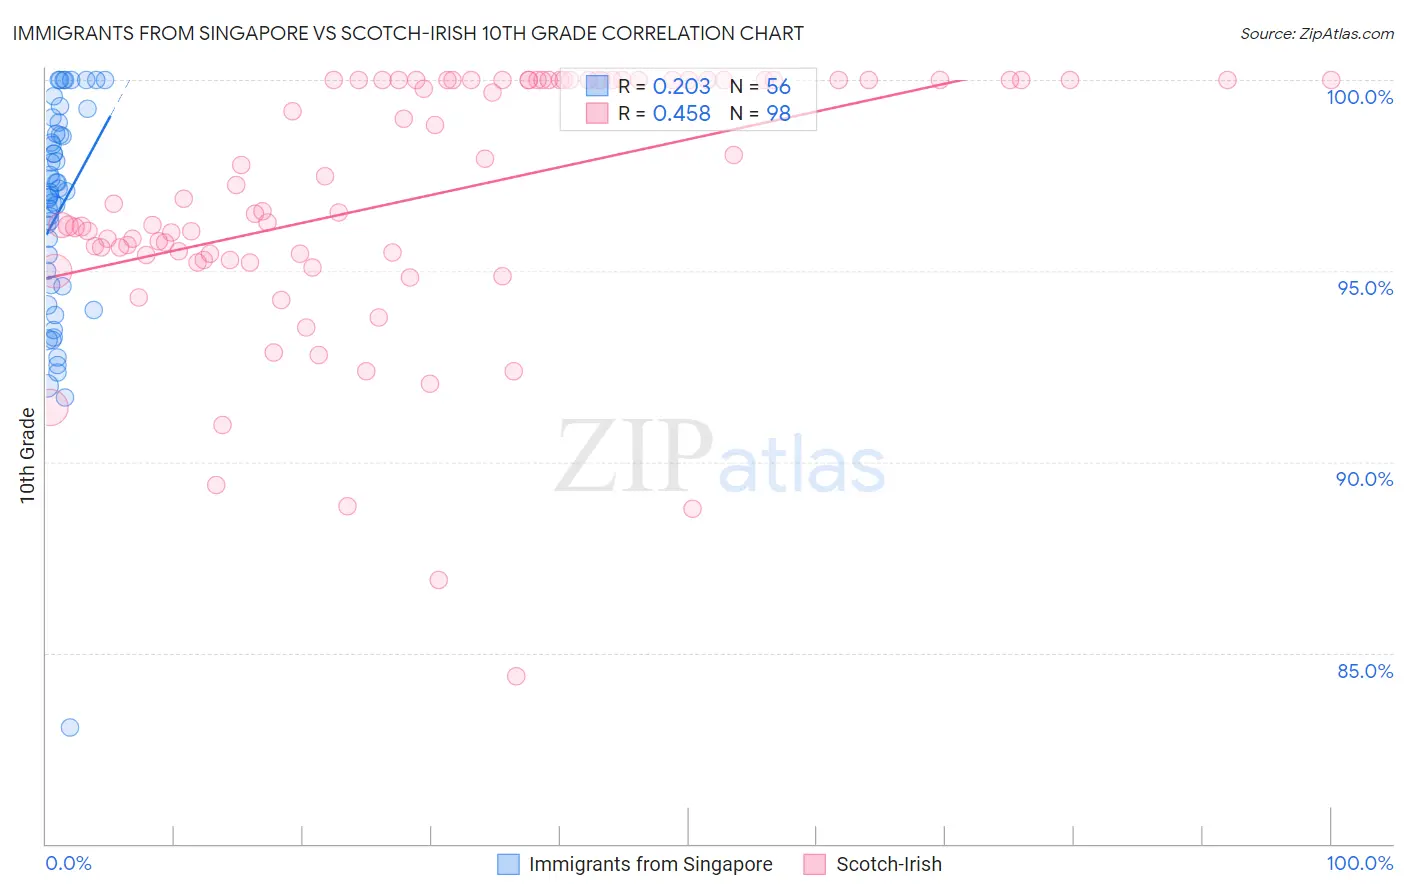
Immigrants from Singapore vs Scotch-Irish 10th Grade Correlation Chart
The statistical analysis conducted on geographies consisting of 137,521,094 people shows a weak positive correlation between the proportion of Immigrants from Singapore and percentage of population with at least 10th grade education in the United States with a correlation coefficient (R) of 0.203 and weighted average of 95.0%. Similarly, the statistical analysis conducted on geographies consisting of 548,777,546 people shows a moderate positive correlation between the proportion of Scotch-Irish and percentage of population with at least 10th grade education in the United States with a correlation coefficient (R) of 0.458 and weighted average of 95.2%, a difference of 0.25%.
10th Grade Correlation Summary
| Measurement | Immigrants from Singapore | Scotch-Irish |
| Minimum | 83.0% | 84.4% |
| Maximum | 100.0% | 100.0% |
| Range | 17.0% | 15.6% |
| Mean | 96.5% | 96.9% |
| Median | 97.1% | 96.7% |
| Interquartile 25% (IQ1) | 94.6% | 95.4% |
| Interquartile 75% (IQ3) | 98.6% | 100.0% |
| Interquartile Range (IQR) | 4.0% | 4.6% |
| Standard Deviation (Sample) | 3.0% | 3.3% |
| Standard Deviation (Population) | 3.0% | 3.3% |
Similar Demographics by 10th Grade
Demographics Similar to Immigrants from Singapore by 10th Grade
In terms of 10th grade, the demographic groups most similar to Immigrants from Singapore are Thai (95.0%, a difference of 0.0%), Cypriot (95.0%, a difference of 0.010%), Chippewa (95.0%, a difference of 0.010%), Native Hawaiian (95.0%, a difference of 0.010%), and Ukrainian (95.0%, a difference of 0.020%).
| Demographics | Rating | Rank | 10th Grade |
| New Zealanders | 99.8 /100 | #56 | Exceptional 95.0% |
| Ukrainians | 99.8 /100 | #57 | Exceptional 95.0% |
| Aleuts | 99.8 /100 | #58 | Exceptional 95.0% |
| Celtics | 99.8 /100 | #59 | Exceptional 95.0% |
| Cypriots | 99.8 /100 | #60 | Exceptional 95.0% |
| Chippewa | 99.8 /100 | #61 | Exceptional 95.0% |
| Thais | 99.8 /100 | #62 | Exceptional 95.0% |
| Immigrants | Singapore | 99.8 /100 | #63 | Exceptional 95.0% |
| Native Hawaiians | 99.7 /100 | #64 | Exceptional 95.0% |
| Turks | 99.7 /100 | #65 | Exceptional 95.0% |
| Immigrants | Australia | 99.7 /100 | #66 | Exceptional 94.9% |
| Immigrants | Netherlands | 99.7 /100 | #67 | Exceptional 94.9% |
| Immigrants | Belgium | 99.7 /100 | #68 | Exceptional 94.9% |
| Immigrants | England | 99.6 /100 | #69 | Exceptional 94.9% |
| Zimbabweans | 99.6 /100 | #70 | Exceptional 94.9% |
Demographics Similar to Scotch-Irish by 10th Grade
In terms of 10th grade, the demographic groups most similar to Scotch-Irish are Immigrants from Scotland (95.2%, a difference of 0.0%), Russian (95.2%, a difference of 0.020%), Northern European (95.3%, a difference of 0.030%), French Canadian (95.3%, a difference of 0.060%), and Slavic (95.2%, a difference of 0.060%).
| Demographics | Rating | Rank | 10th Grade |
| French | 100.0 /100 | #33 | Exceptional 95.3% |
| British | 99.9 /100 | #34 | Exceptional 95.3% |
| Estonians | 99.9 /100 | #35 | Exceptional 95.3% |
| Immigrants | India | 99.9 /100 | #36 | Exceptional 95.3% |
| French Canadians | 99.9 /100 | #37 | Exceptional 95.3% |
| Northern Europeans | 99.9 /100 | #38 | Exceptional 95.3% |
| Immigrants | Scotland | 99.9 /100 | #39 | Exceptional 95.2% |
| Scotch-Irish | 99.9 /100 | #40 | Exceptional 95.2% |
| Russians | 99.9 /100 | #41 | Exceptional 95.2% |
| Slavs | 99.9 /100 | #42 | Exceptional 95.2% |
| Macedonians | 99.9 /100 | #43 | Exceptional 95.2% |
| Immigrants | Northern Europe | 99.9 /100 | #44 | Exceptional 95.2% |
| Greeks | 99.9 /100 | #45 | Exceptional 95.2% |
| Czechoslovakians | 99.9 /100 | #46 | Exceptional 95.1% |
| Serbians | 99.9 /100 | #47 | Exceptional 95.1% |