Immigrants from Syria vs Salvadoran 9th Grade
COMPARE
Immigrants from Syria
Salvadoran
9th Grade
9th Grade Comparison
Immigrants from Syria
Salvadorans
94.5%
9TH GRADE
11.0/ 100
METRIC RATING
215th/ 347
METRIC RANK
89.6%
9TH GRADE
0.0/ 100
METRIC RATING
342nd/ 347
METRIC RANK
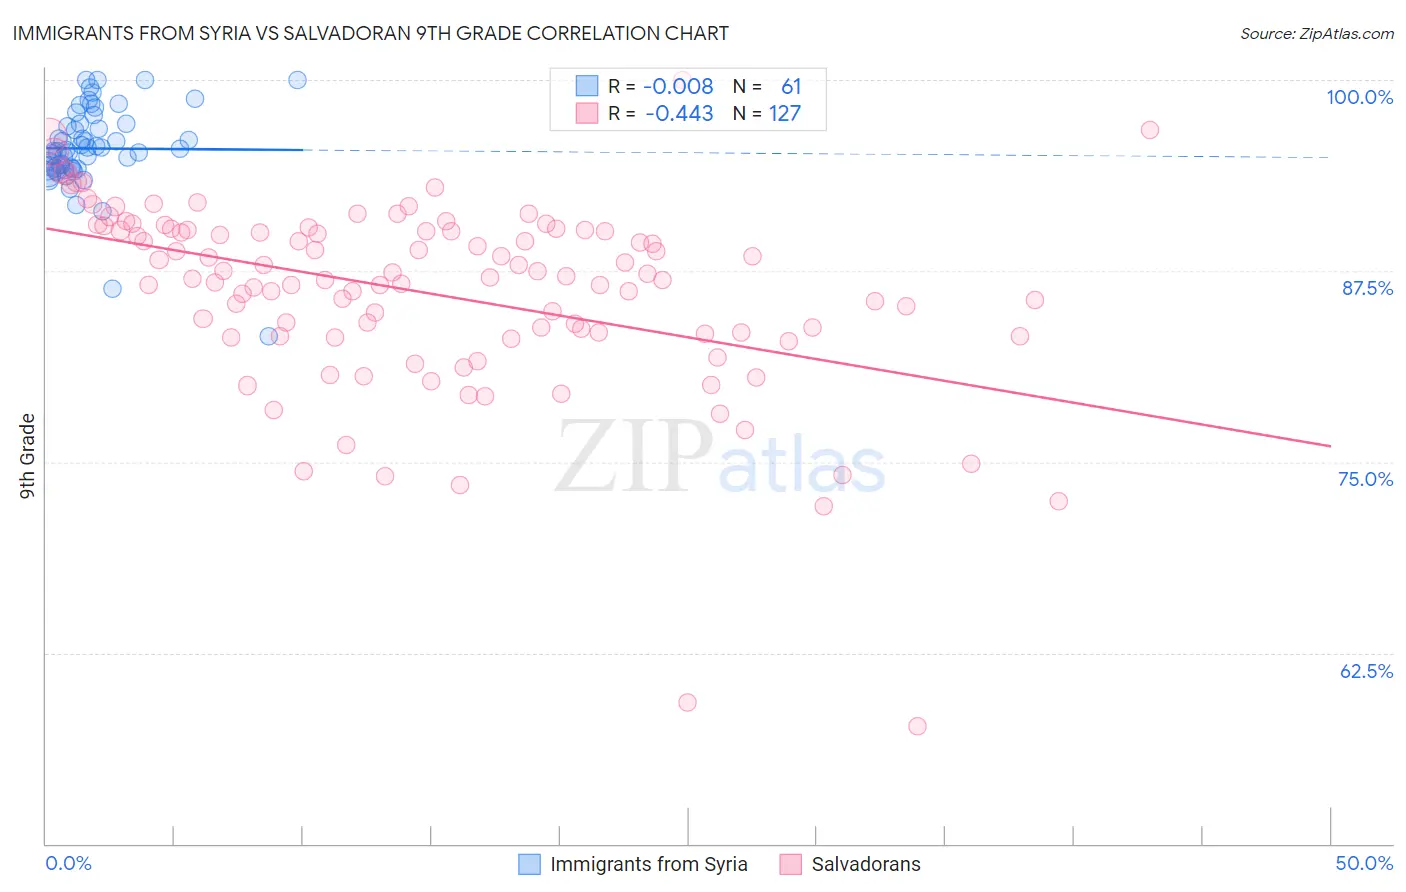
Immigrants from Syria vs Salvadoran 9th Grade Correlation Chart
The statistical analysis conducted on geographies consisting of 174,108,882 people shows no correlation between the proportion of Immigrants from Syria and percentage of population with at least 9th grade education in the United States with a correlation coefficient (R) of -0.008 and weighted average of 94.5%. Similarly, the statistical analysis conducted on geographies consisting of 399,034,410 people shows a moderate negative correlation between the proportion of Salvadorans and percentage of population with at least 9th grade education in the United States with a correlation coefficient (R) of -0.443 and weighted average of 89.6%, a difference of 5.5%.
9th Grade Correlation Summary
| Measurement | Immigrants from Syria | Salvadoran |
| Minimum | 83.2% | 57.7% |
| Maximum | 100.0% | 100.0% |
| Range | 16.8% | 42.3% |
| Mean | 95.5% | 86.0% |
| Median | 95.5% | 87.0% |
| Interquartile 25% (IQ1) | 94.2% | 83.2% |
| Interquartile 75% (IQ3) | 97.1% | 90.2% |
| Interquartile Range (IQR) | 2.9% | 7.0% |
| Standard Deviation (Sample) | 2.9% | 6.4% |
| Standard Deviation (Population) | 2.8% | 6.3% |
Similar Demographics by 9th Grade
Demographics Similar to Immigrants from Syria by 9th Grade
In terms of 9th grade, the demographic groups most similar to Immigrants from Syria are Immigrants from Liberia (94.5%, a difference of 0.010%), Immigrants from Western Asia (94.5%, a difference of 0.010%), Immigrants from Indonesia (94.5%, a difference of 0.020%), Immigrants from Malaysia (94.5%, a difference of 0.020%), and Immigrants from Oceania (94.5%, a difference of 0.020%).
| Demographics | Rating | Rank | 9th Grade |
| Immigrants | Pakistan | 15.5 /100 | #208 | Poor 94.6% |
| Comanche | 14.9 /100 | #209 | Poor 94.6% |
| Immigrants | Chile | 13.4 /100 | #210 | Poor 94.5% |
| Immigrants | Indonesia | 12.3 /100 | #211 | Poor 94.5% |
| Immigrants | Malaysia | 12.2 /100 | #212 | Poor 94.5% |
| Immigrants | Oceania | 12.1 /100 | #213 | Poor 94.5% |
| Immigrants | Liberia | 11.8 /100 | #214 | Poor 94.5% |
| Immigrants | Syria | 11.0 /100 | #215 | Poor 94.5% |
| Immigrants | Western Asia | 10.7 /100 | #216 | Poor 94.5% |
| Asians | 9.9 /100 | #217 | Tragic 94.5% |
| Portuguese | 9.2 /100 | #218 | Tragic 94.5% |
| Africans | 9.0 /100 | #219 | Tragic 94.5% |
| Indians (Asian) | 8.6 /100 | #220 | Tragic 94.5% |
| Immigrants | Eastern Africa | 8.2 /100 | #221 | Tragic 94.5% |
| Immigrants | Asia | 7.7 /100 | #222 | Tragic 94.4% |
Demographics Similar to Salvadorans by 9th Grade
In terms of 9th grade, the demographic groups most similar to Salvadorans are Immigrants from Guatemala (89.4%, a difference of 0.20%), Guatemalan (89.9%, a difference of 0.31%), Mexican (90.0%, a difference of 0.43%), Yakama (90.1%, a difference of 0.49%), and Immigrants from El Salvador (89.0%, a difference of 0.71%).
| Demographics | Rating | Rank | 9th Grade |
| Immigrants | Yemen | 0.0 /100 | #333 | Tragic 90.8% |
| Immigrants | Azores | 0.0 /100 | #334 | Tragic 90.8% |
| Immigrants | Honduras | 0.0 /100 | #335 | Tragic 90.6% |
| Immigrants | Dominican Republic | 0.0 /100 | #336 | Tragic 90.5% |
| Immigrants | Latin America | 0.0 /100 | #337 | Tragic 90.4% |
| Central Americans | 0.0 /100 | #338 | Tragic 90.4% |
| Yakama | 0.0 /100 | #339 | Tragic 90.1% |
| Mexicans | 0.0 /100 | #340 | Tragic 90.0% |
| Guatemalans | 0.0 /100 | #341 | Tragic 89.9% |
| Salvadorans | 0.0 /100 | #342 | Tragic 89.6% |
| Immigrants | Guatemala | 0.0 /100 | #343 | Tragic 89.4% |
| Immigrants | El Salvador | 0.0 /100 | #344 | Tragic 89.0% |
| Immigrants | Central America | 0.0 /100 | #345 | Tragic 89.0% |
| Immigrants | Mexico | 0.0 /100 | #346 | Tragic 88.7% |
| Spanish American Indians | 0.0 /100 | #347 | Tragic 88.3% |